04
Groundwater
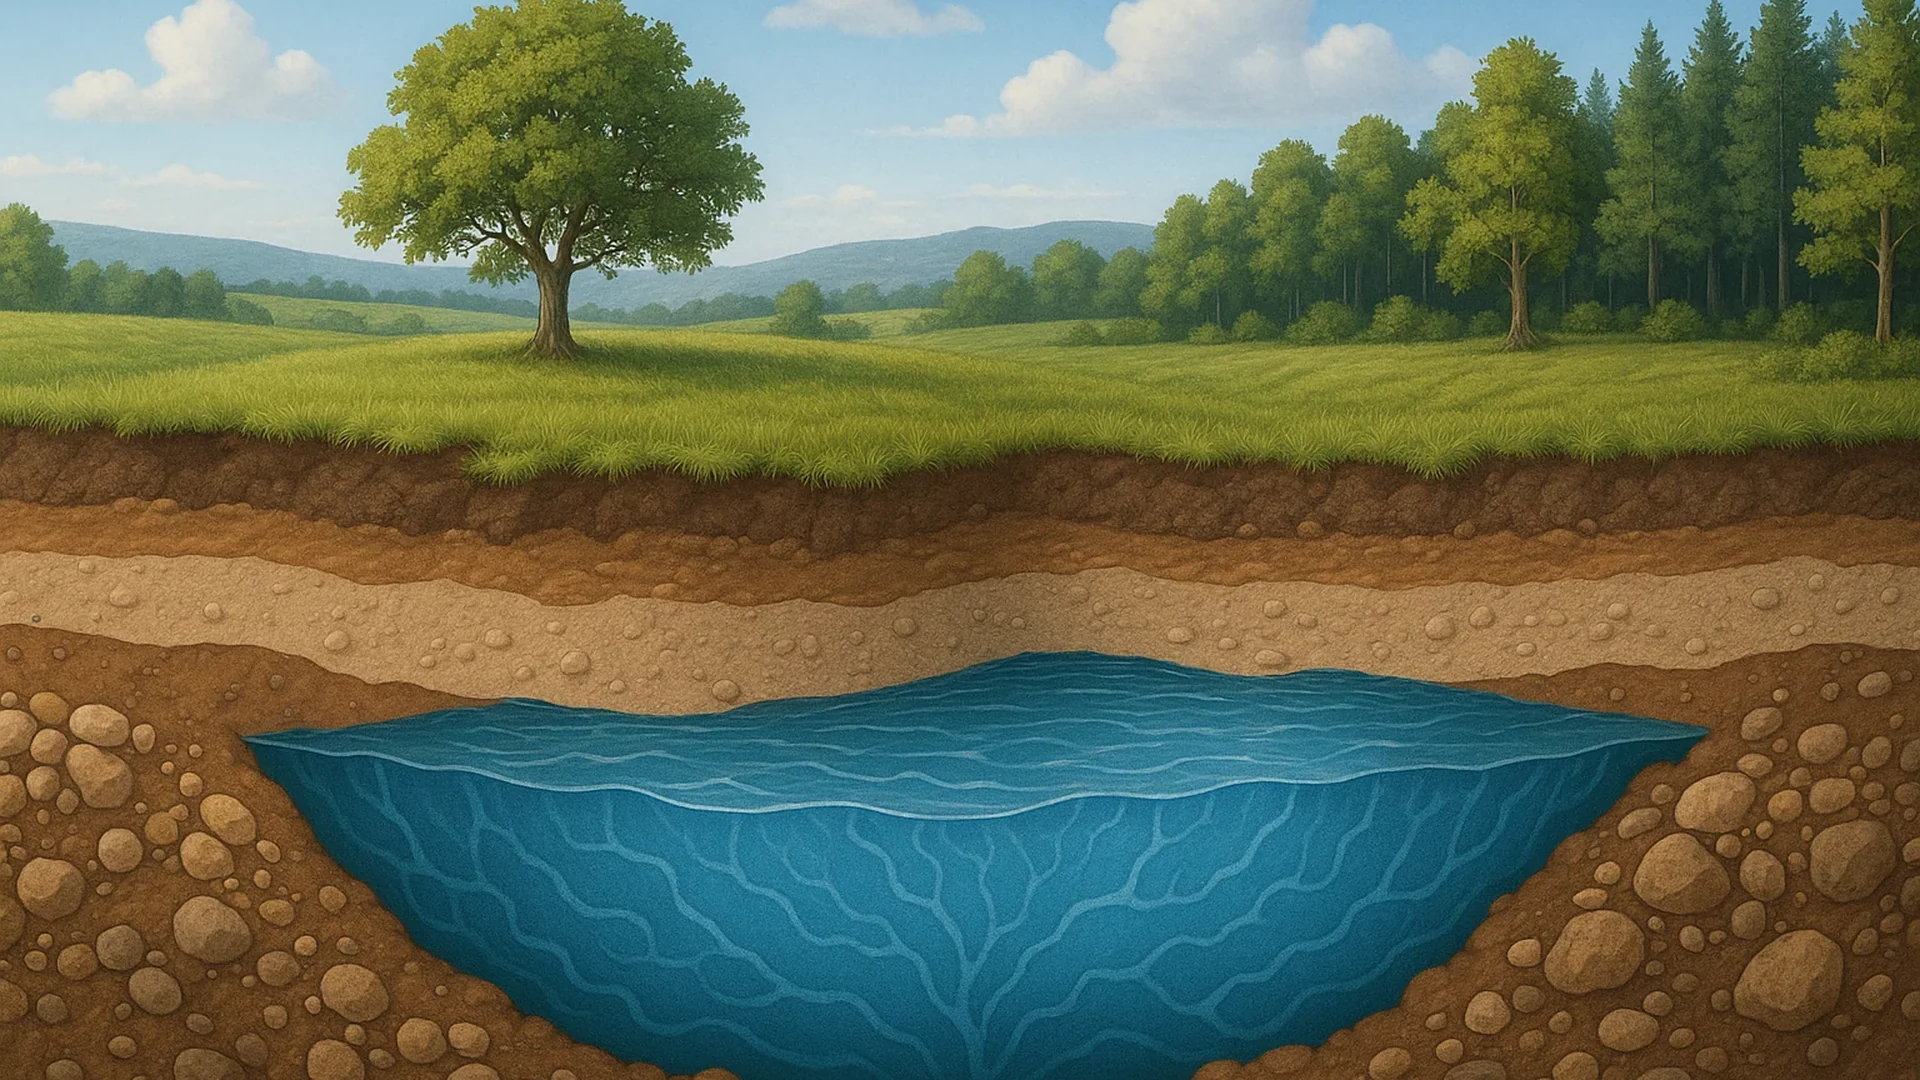
Aquifer identification for industrial, municipal and agricultural supply, read on the same spectral principle as any other subsurface target.
Satellite-based direct detection
Remote spectral analysis converts held acreage into a ranked, drill-ready target list.





The cost of not knowing
Satellite-based spectral detection maps element concentration and depth before the first rig moves.
Where we can survey
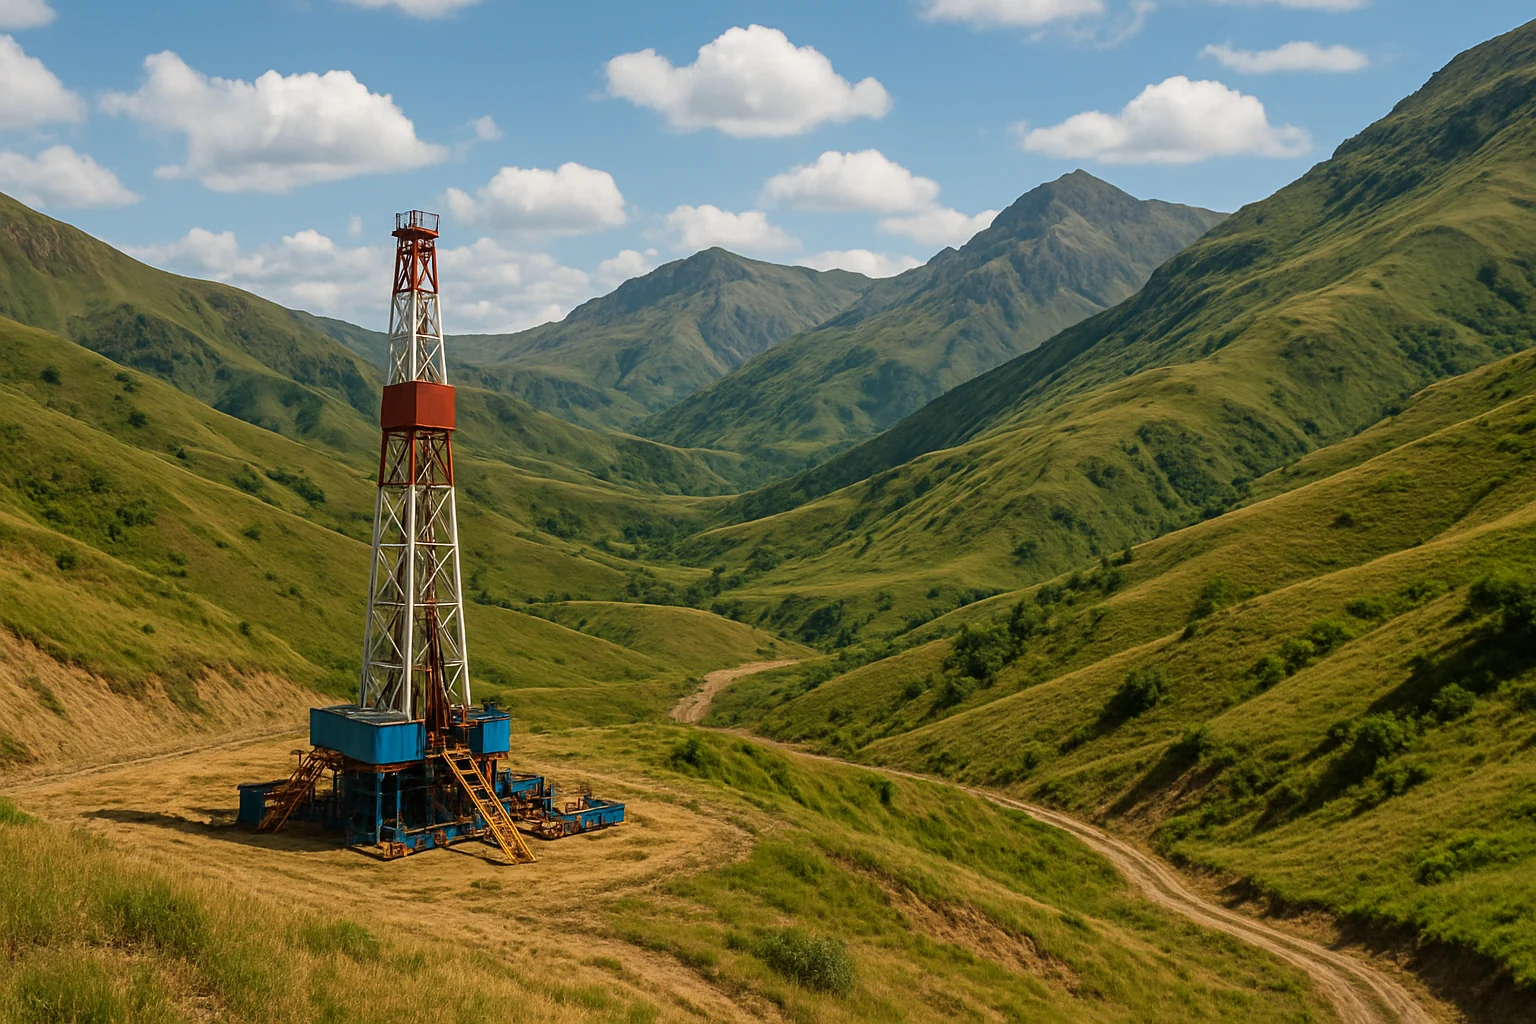
Deserts, high Himalayas, dense forests, offshore acreage — expensive, slow, or simply impossible to survey conventionally. All of it is within our reach.
 Hilly terrain
 Desert
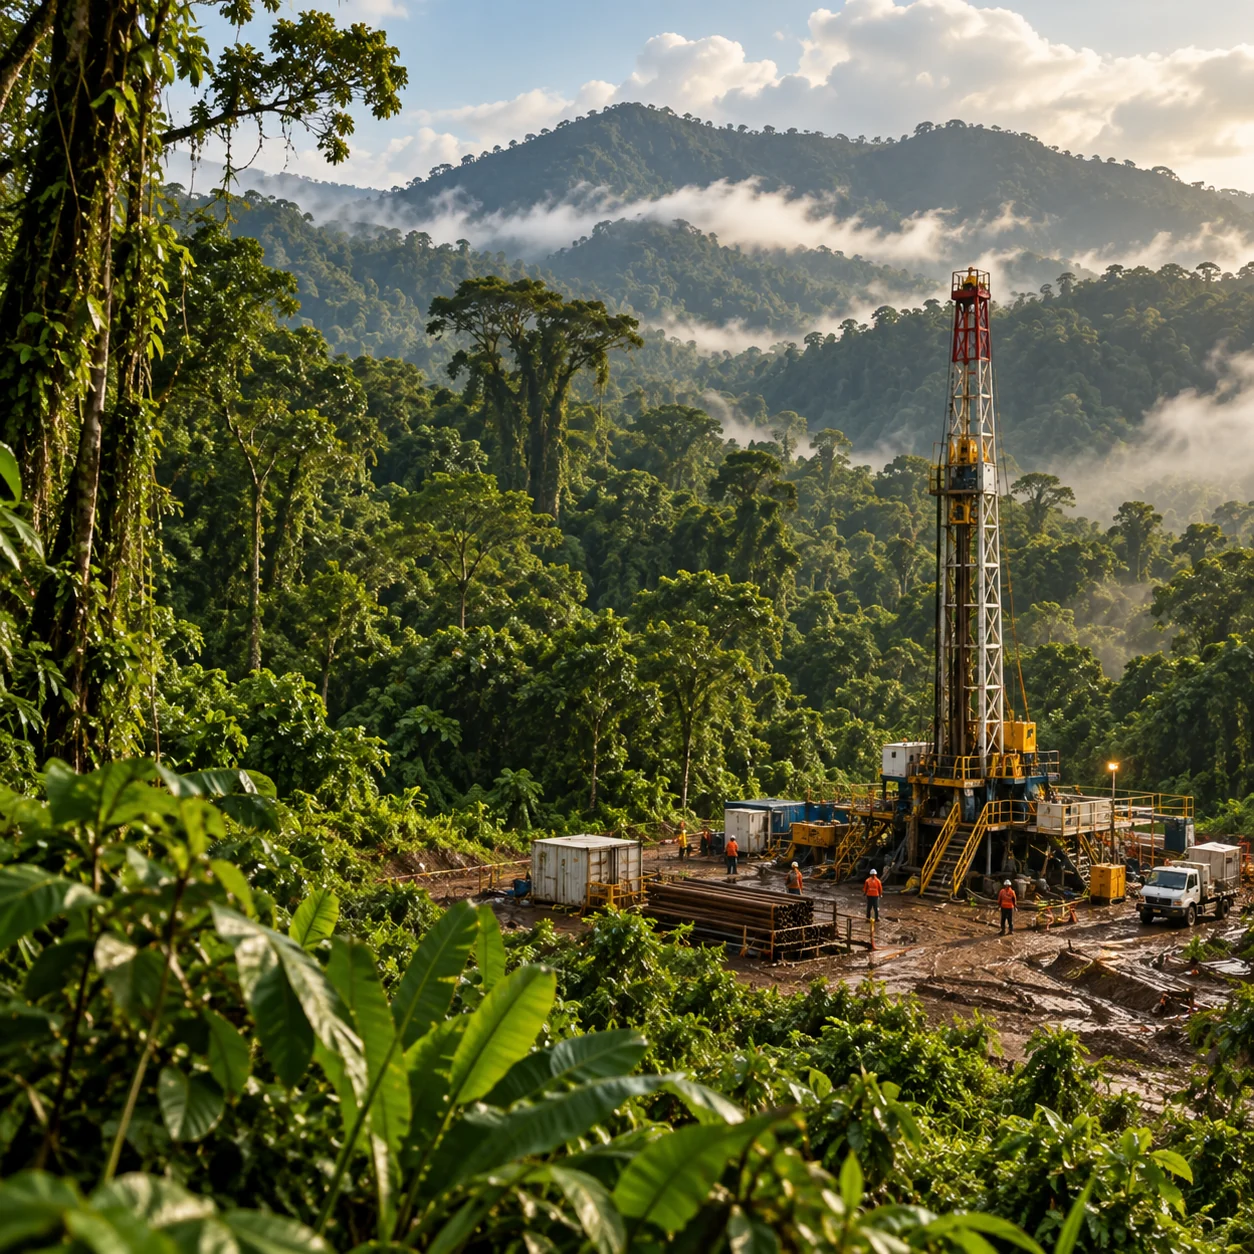 Dense vegetation
 Environmentally sensitive zones
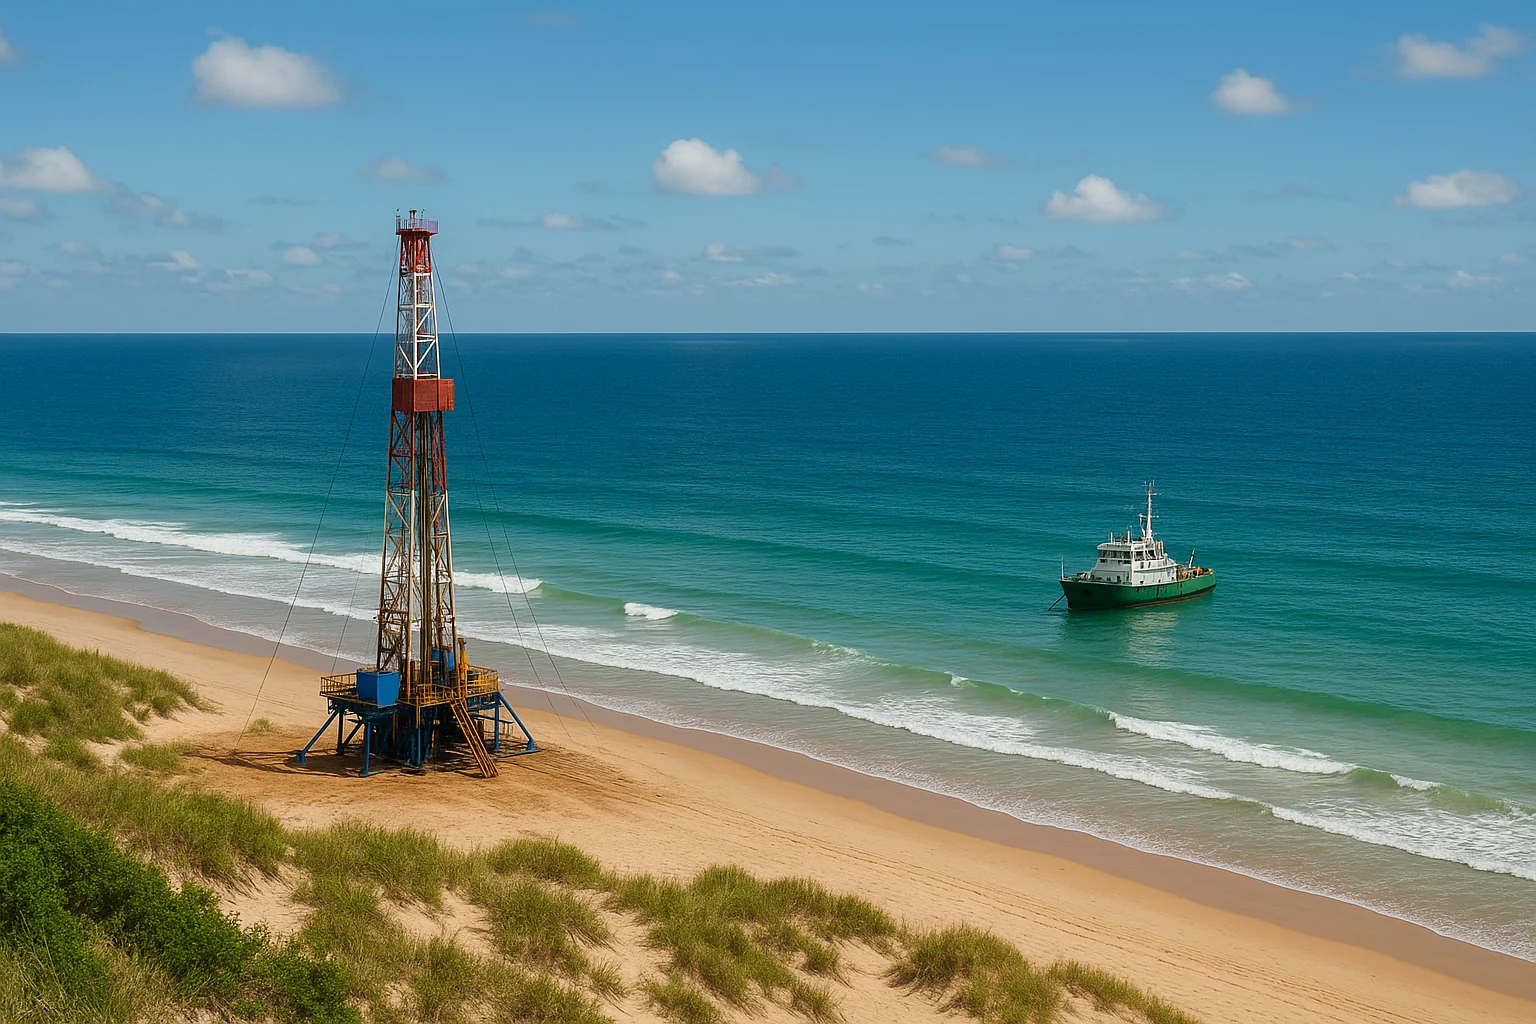 Transition zones
 Offshore
No ground disturbance, no site access, no clearance required to run the survey.
The method
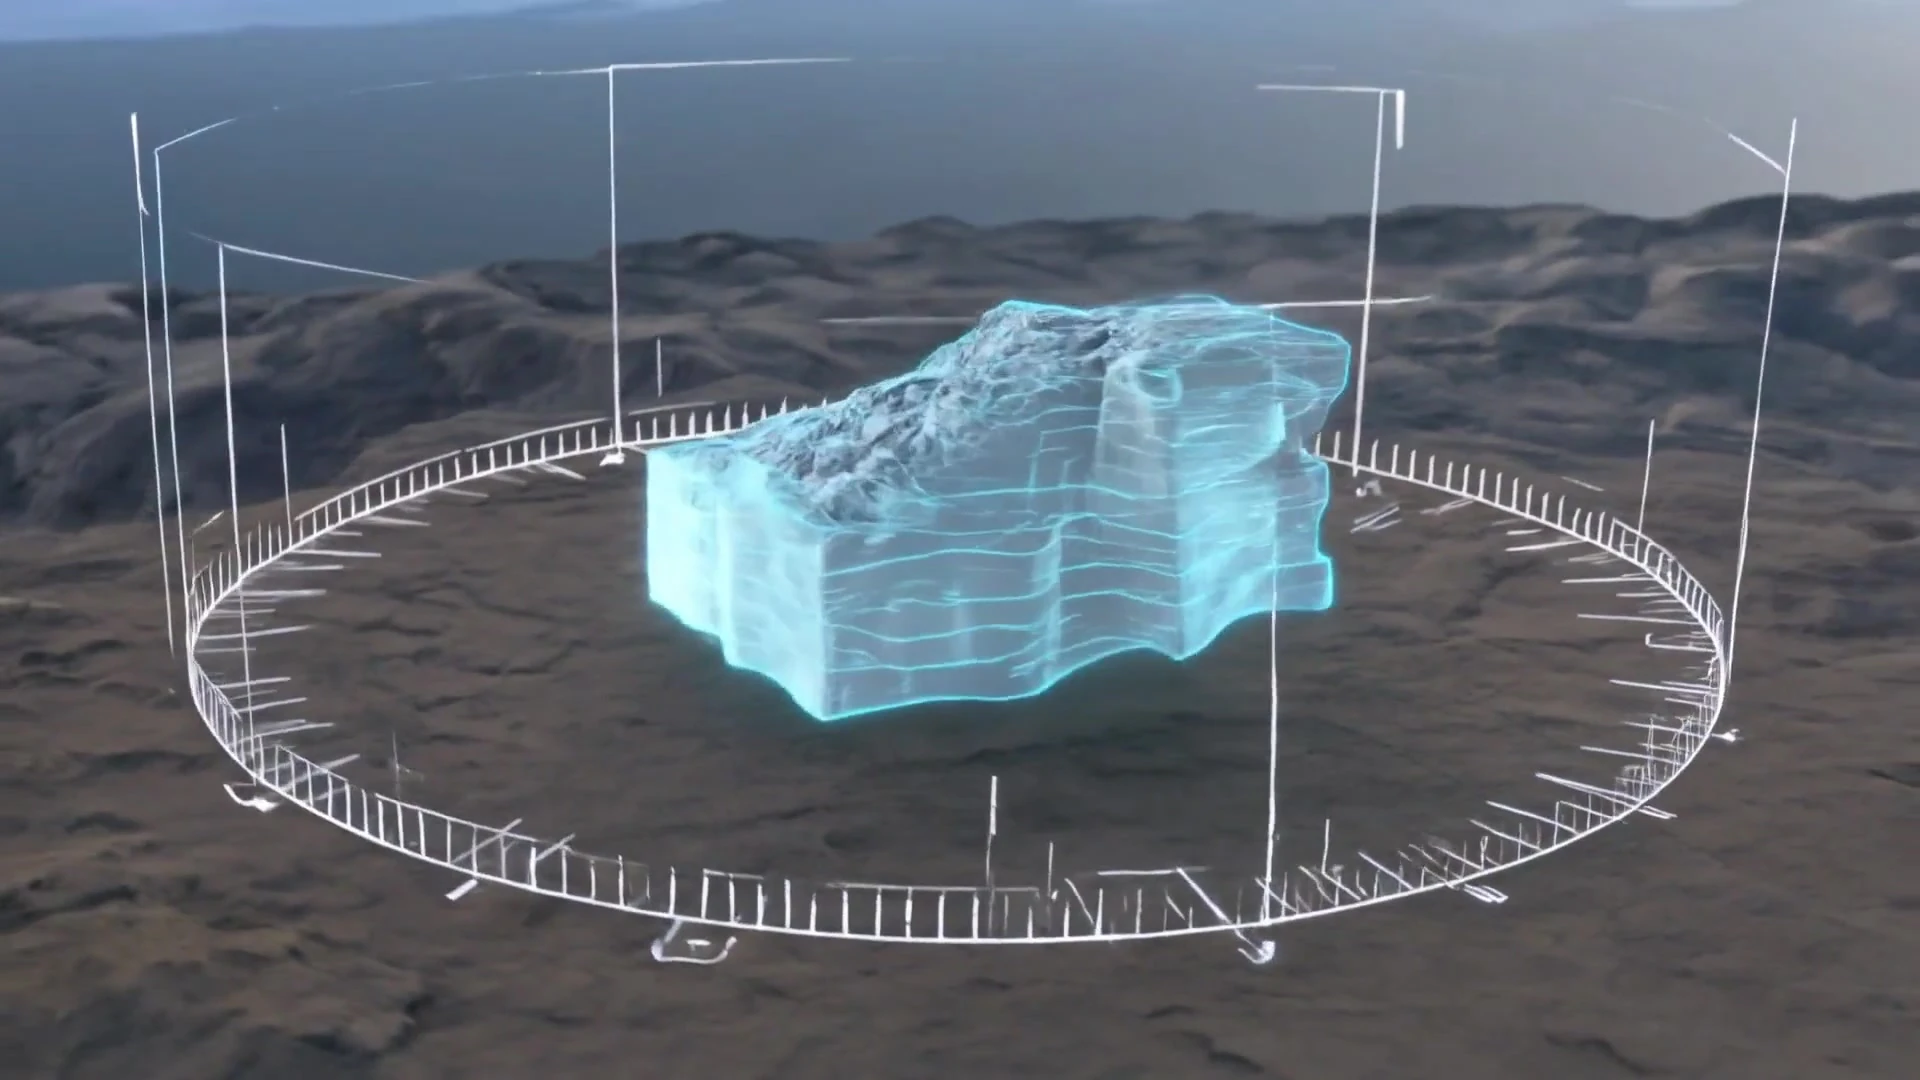
Multispectral imagery and electromagnetic spectral analysis read the subsurface directly. The block is surveyed, filtered and modelled before anyone sets foot on it.
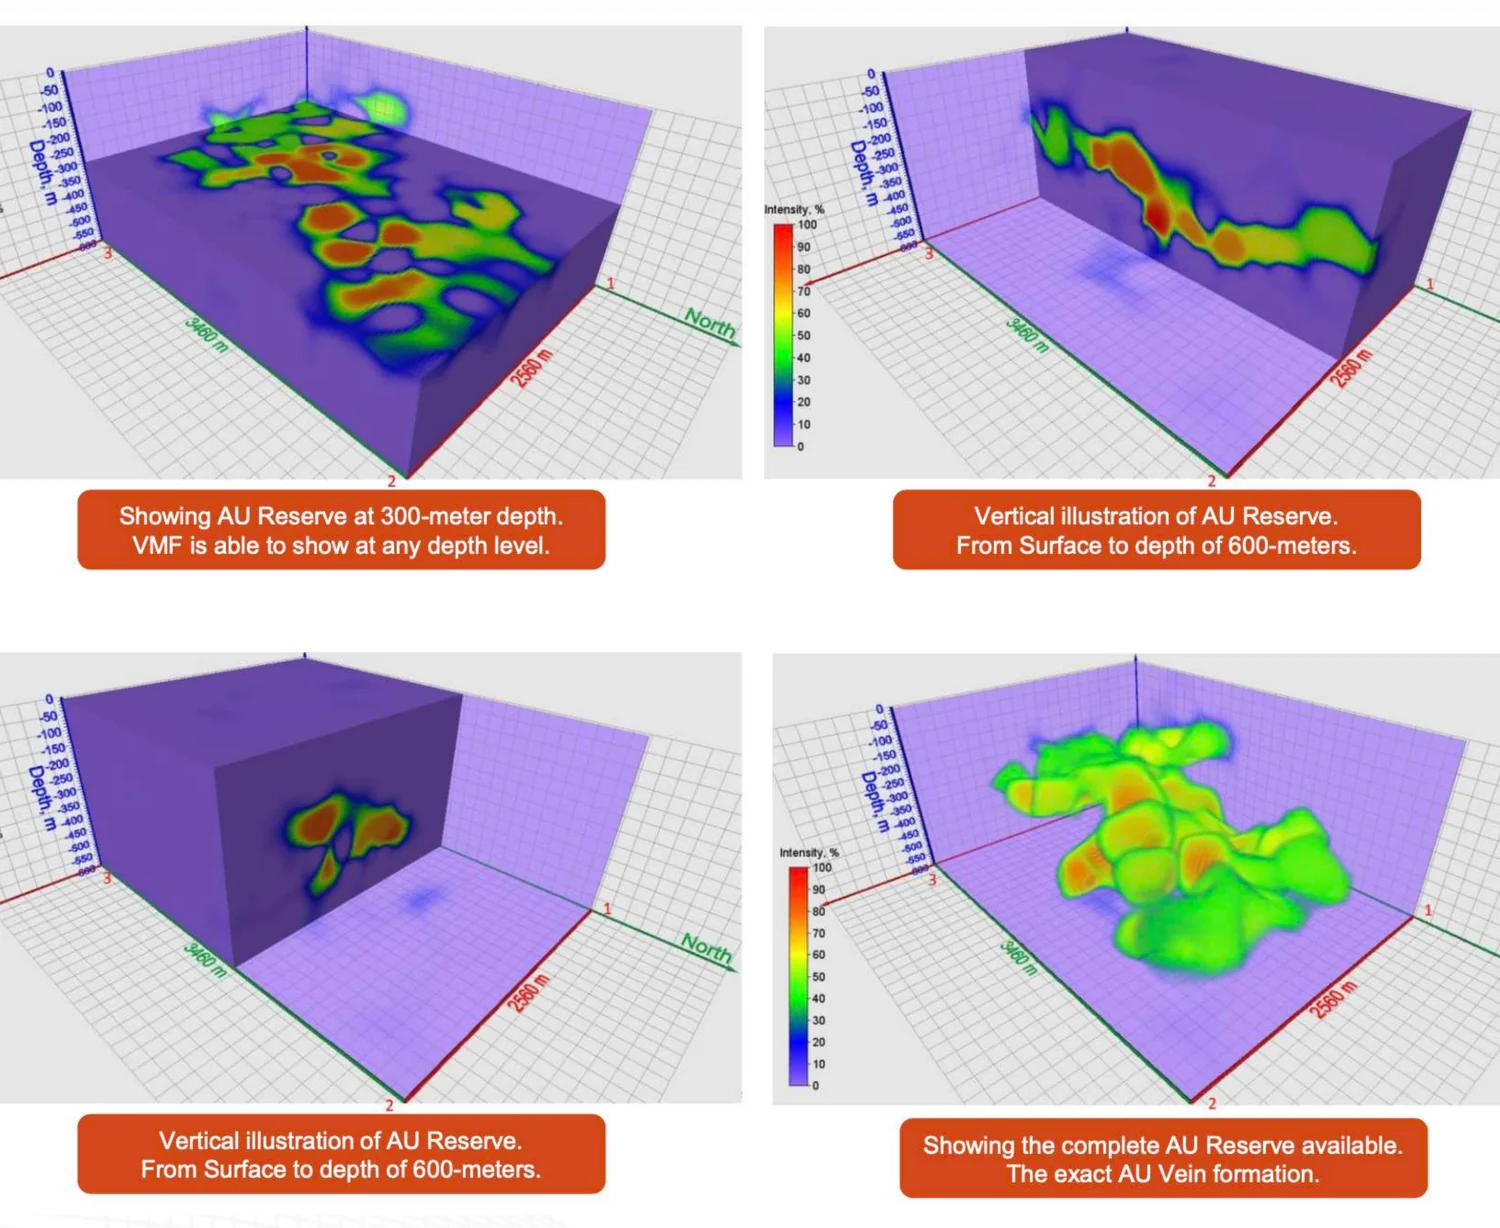
The sequence
Step 01 · Frame the block
The tract is defined by its corner coordinates — tens of square kilometres at a time, taken in a single pass rather than walked line by line.
Industries we serve
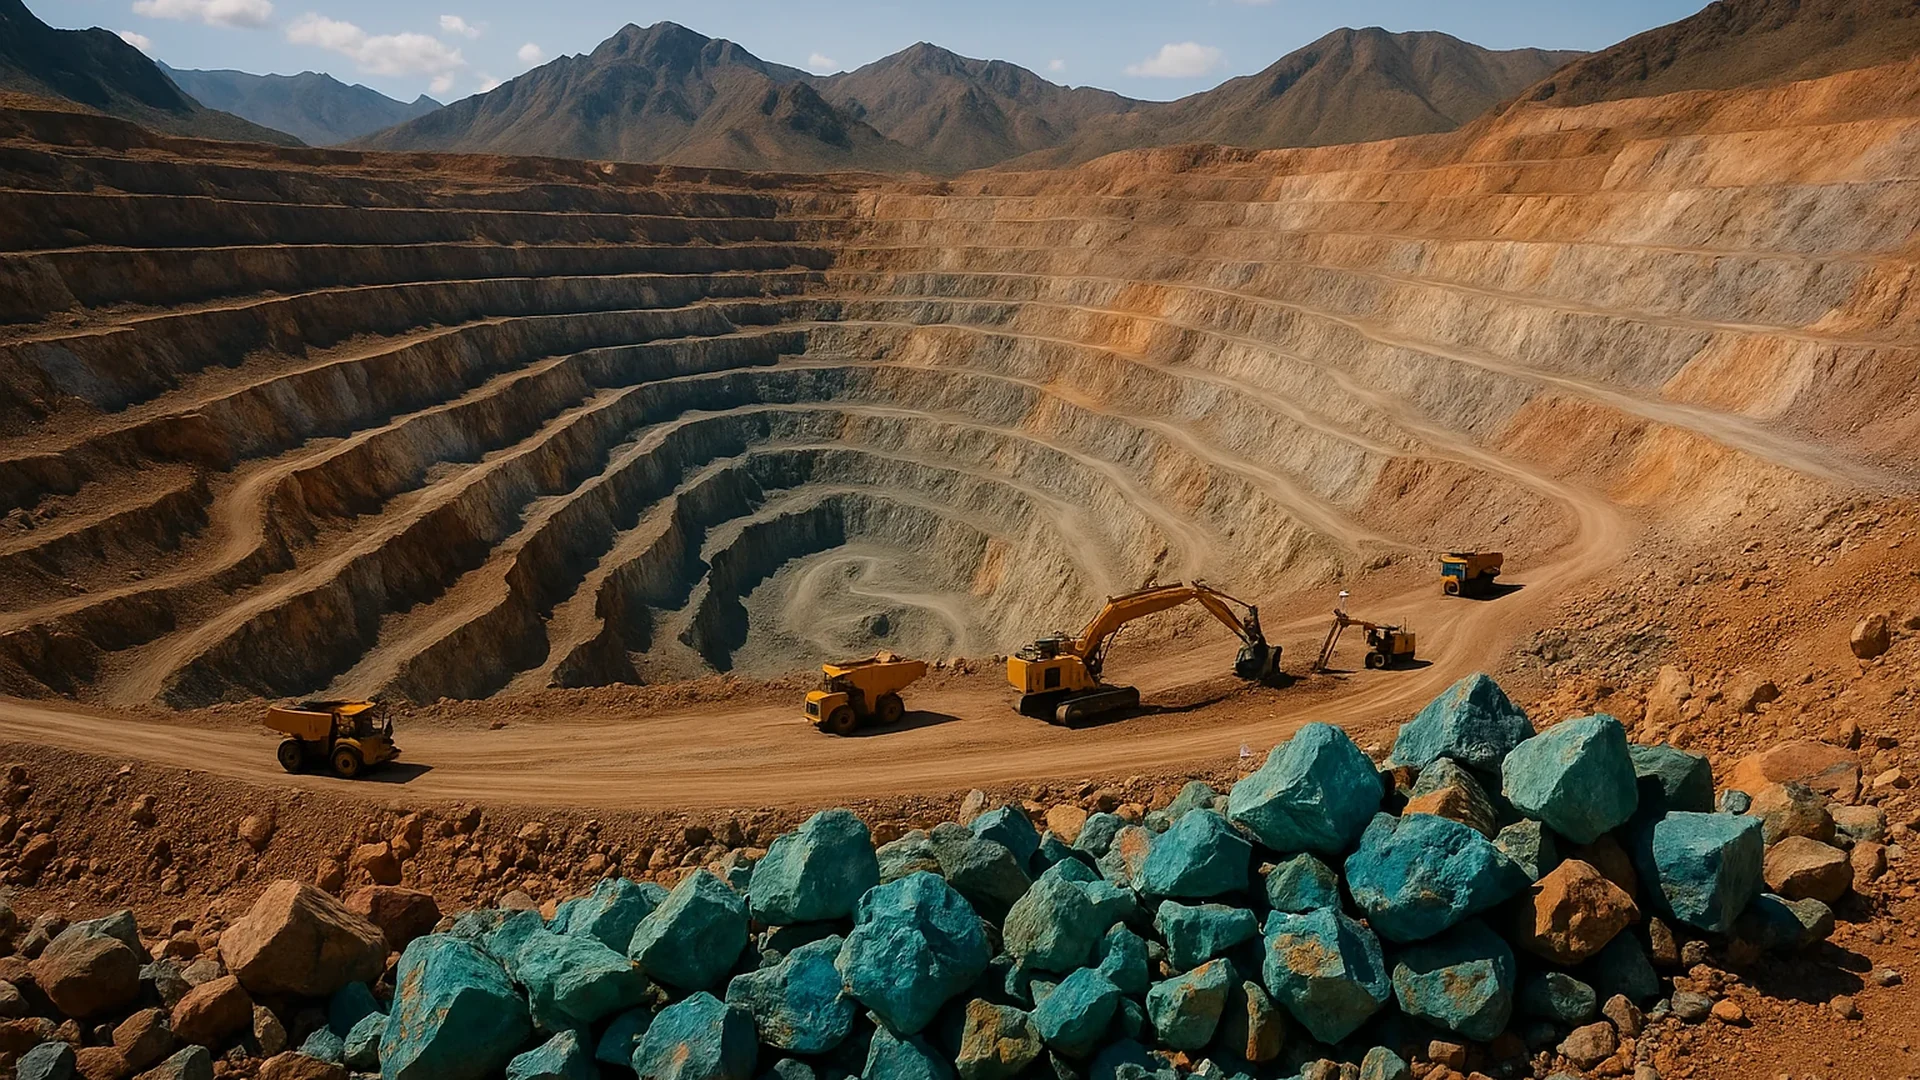
Strategic inputs that national programmes and supply chains are now built around — surveyed element by element, with the target set before acquisition begins.
Read more →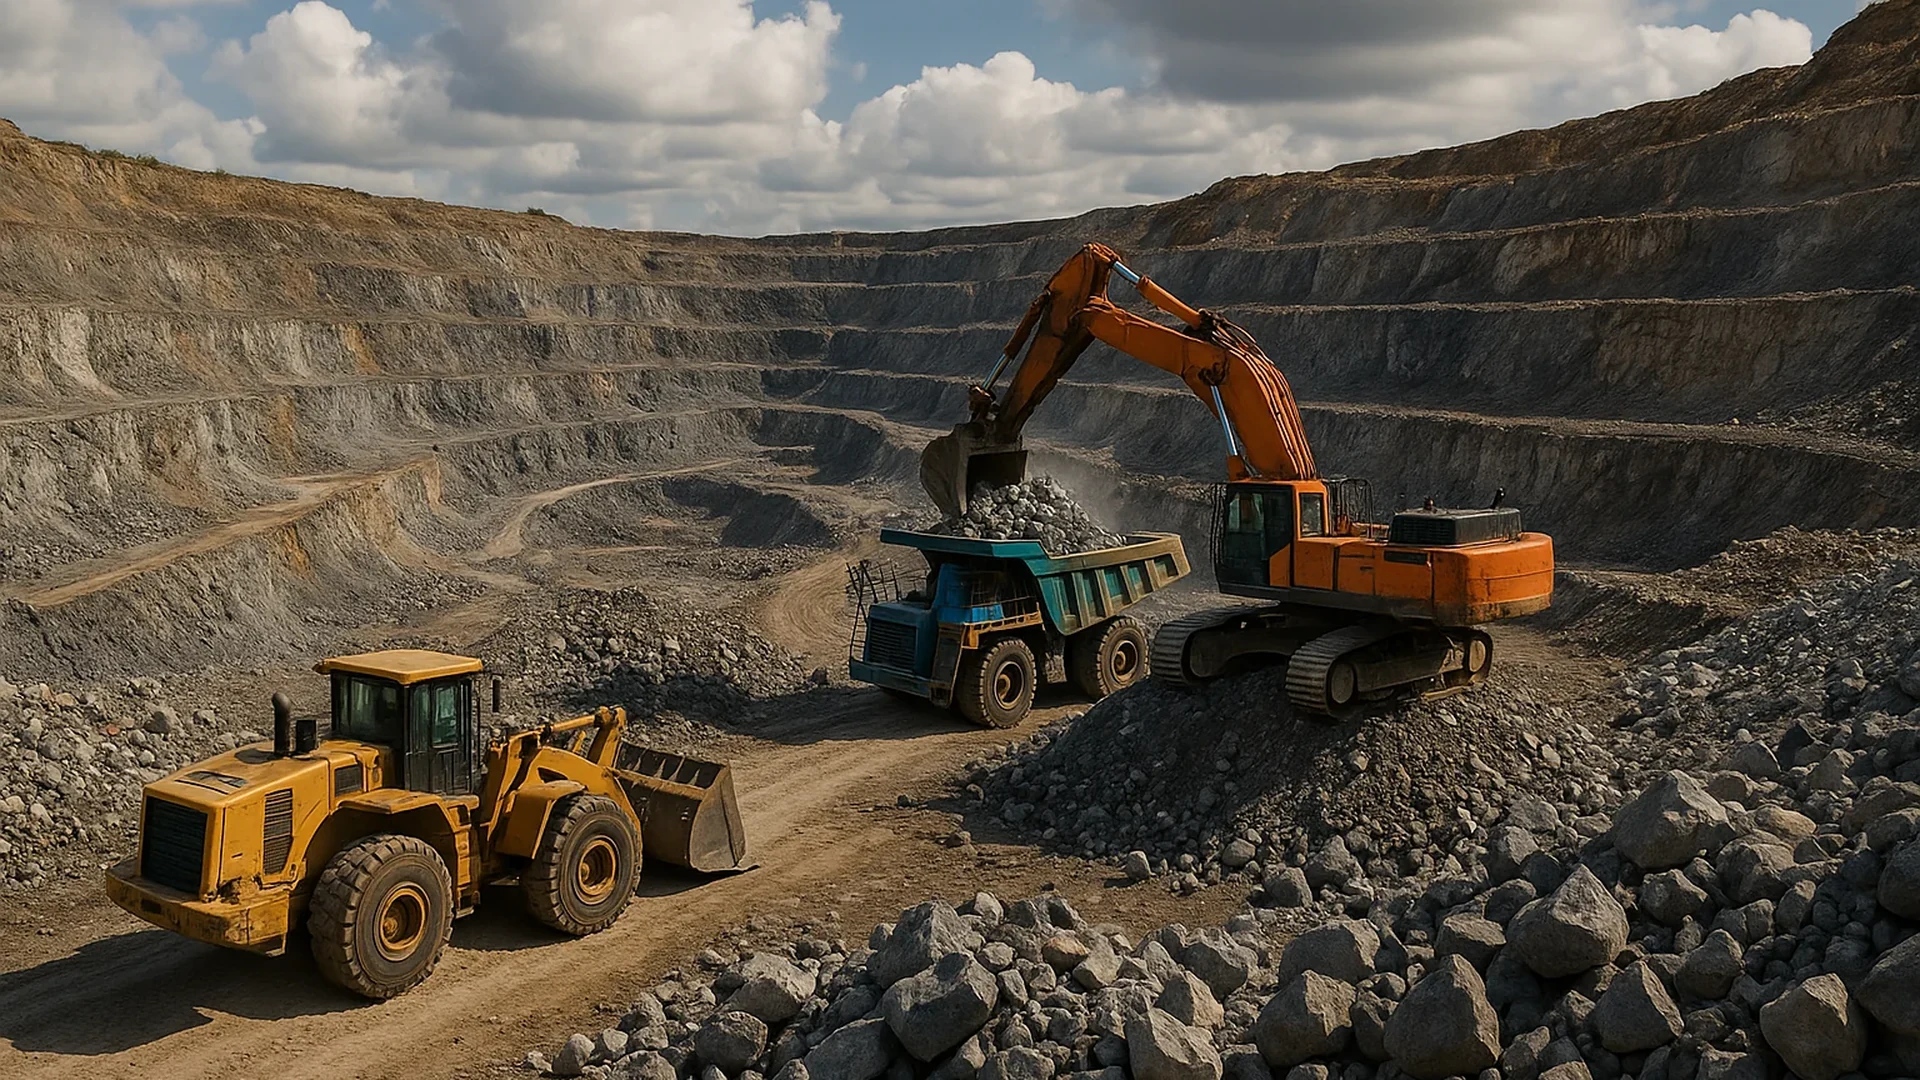
Gold, copper and base metals mapped by concentration and depth across a licence area, before a single confirmation hole is planned.
Read more →
Hydrocarbon signatures resolved to depth across frontier acreage and producing blocks alike, including Category II and III basins assessed on the same basis as a producing block.
Read more →Aquifer identification for industrial, municipal and agricultural supply, read on the same spectral principle as any other subsurface target.

Kimberlite pipes carry their own spectral signature. The same survey that maps a metallic target can be run for diamondiferous ground.

Buried structures and material remains sit within reach of the same detection depth, mapped before a single trench is opened.
Send the corner coordinates of the block. We will tell you which targets the spectral data can resolve on that ground, and to what depth, before anything is committed.
Send a blockCritical minerals
Remote detection that shortens the path from block award to production decision.
Spectral detection maps element concentration and depth across your block, so drilling starts with a ranked target list instead of a hypothesis.
Completed detections

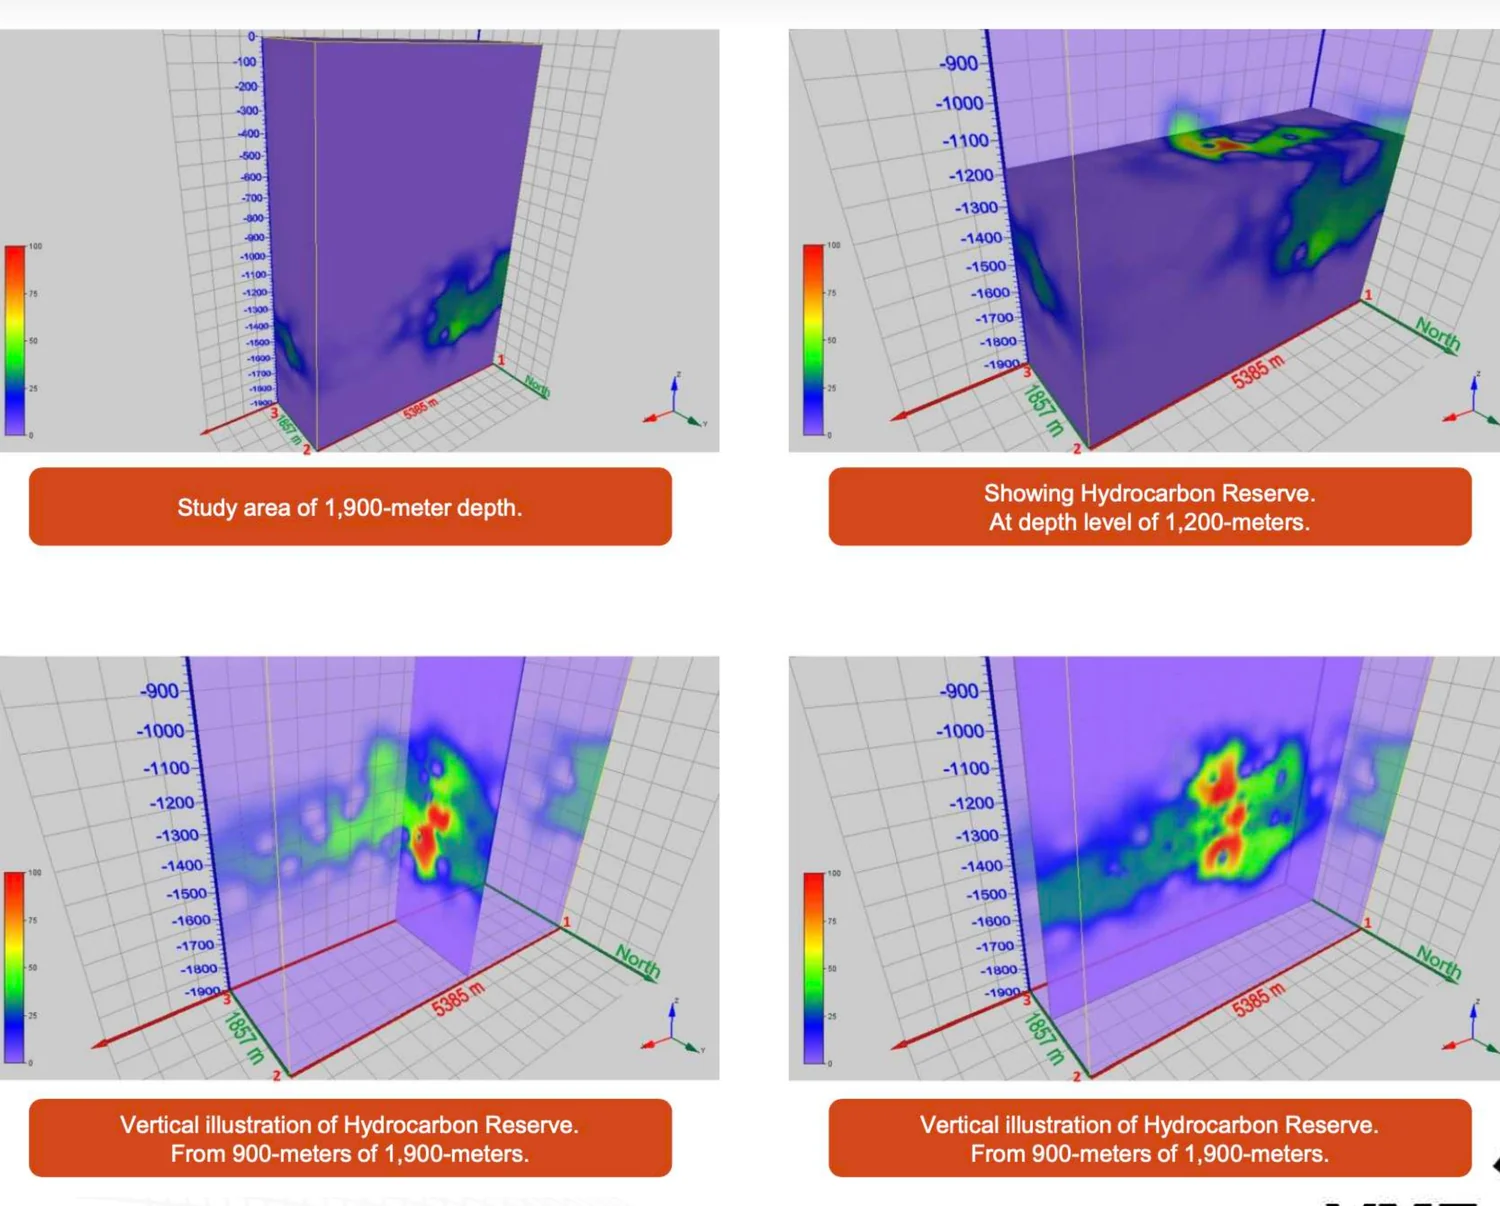
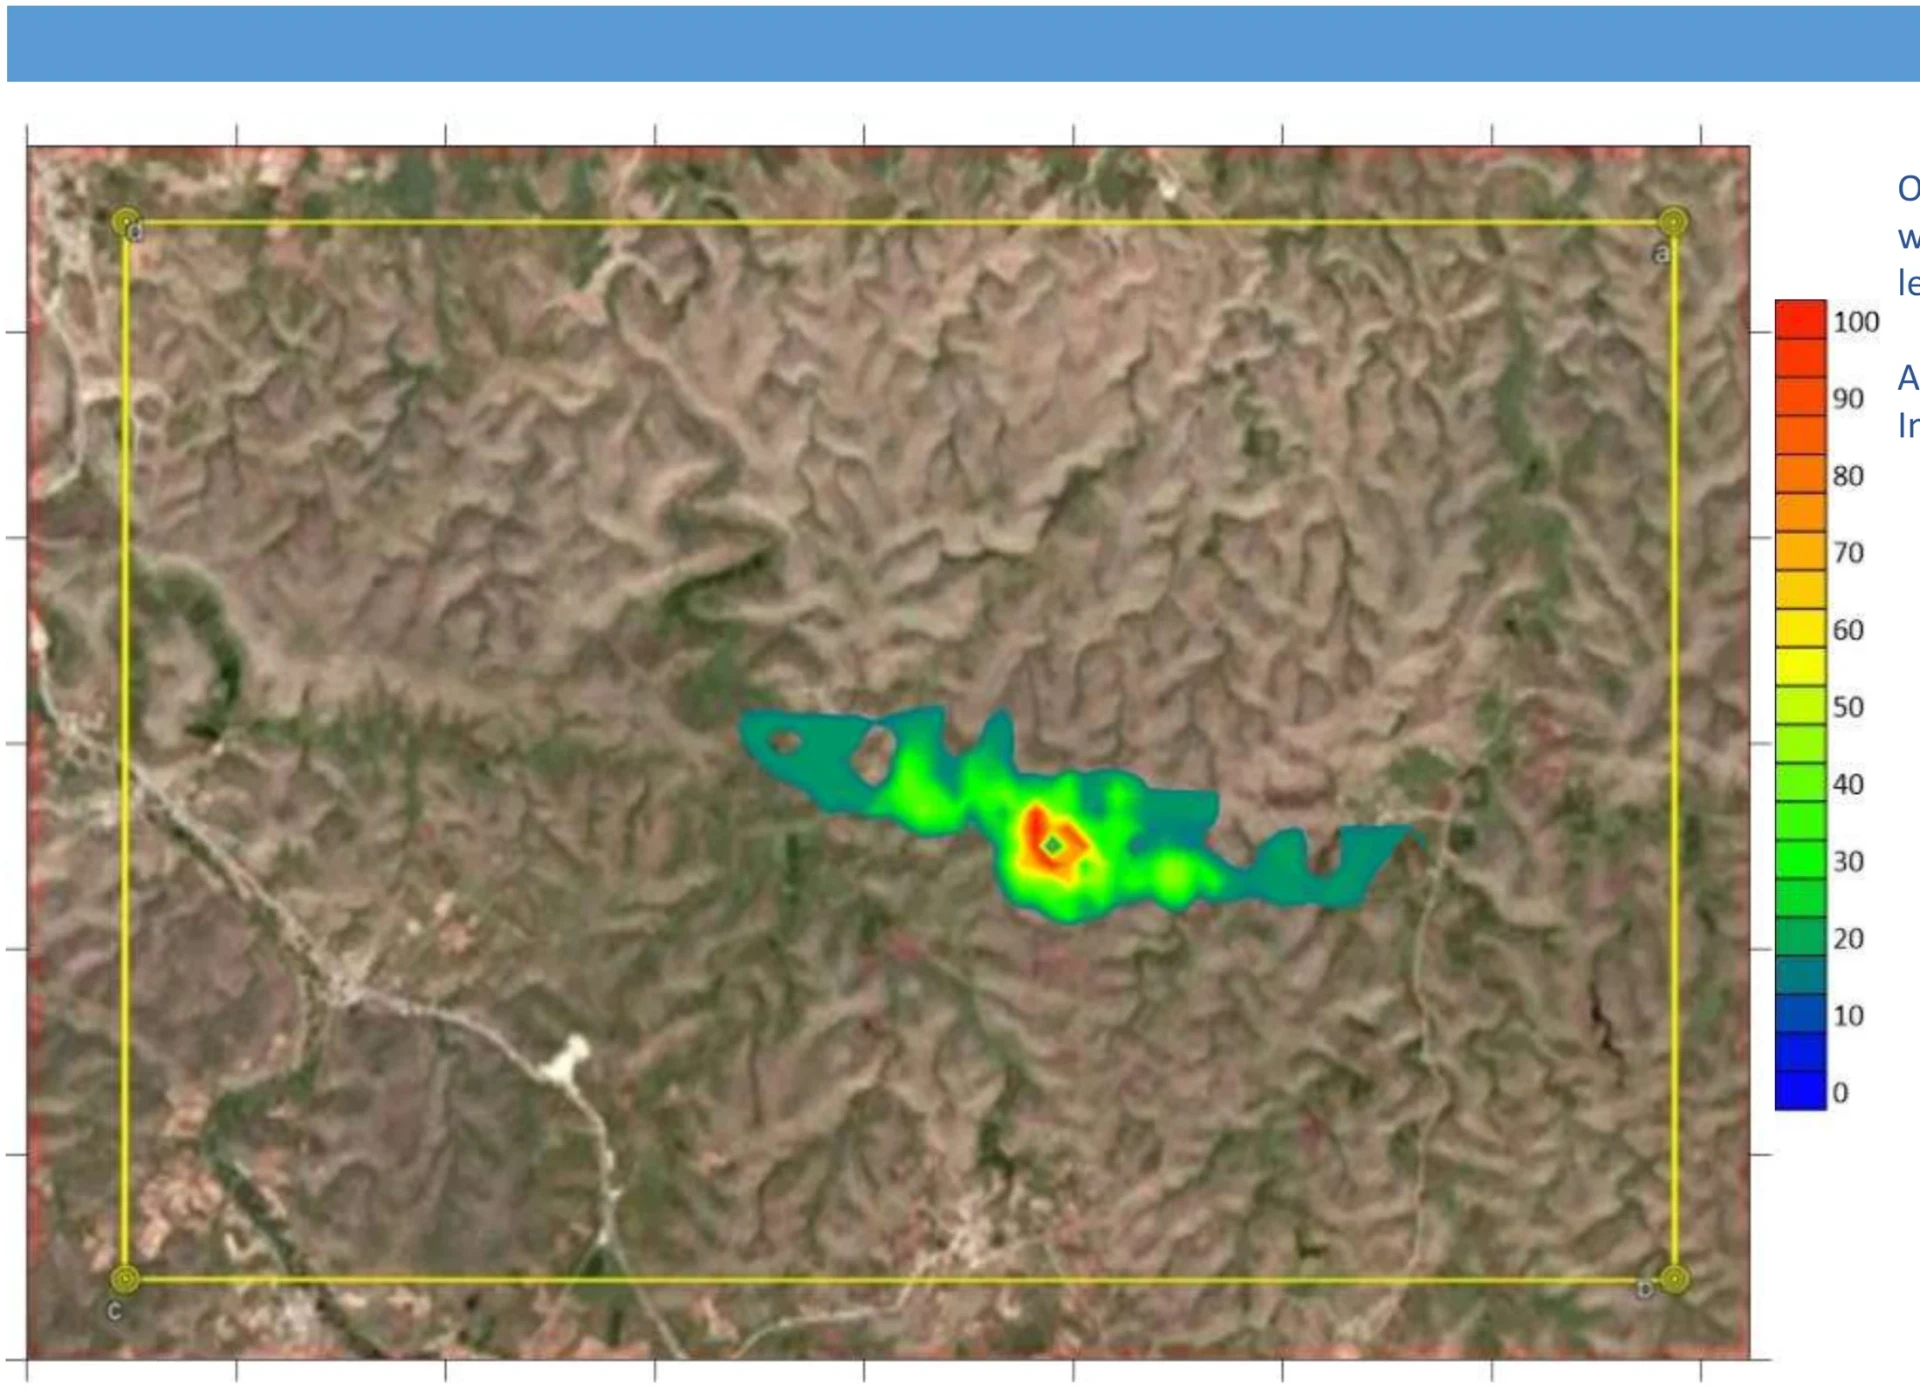
Turkey · 2019
Area surveyed 100 km² · anomaly resolved across 16 km² · 3D block modelled 900–1,900 m · elements C, H, S, N.
A hydrocarbon survey across the full licence area. The signature was resolved to a smaller zone inside it, and that zone was modelled in depth with drilling reference points, so target intervals could be planned before anything was mobilised.
Sharjah, UAE · 2019
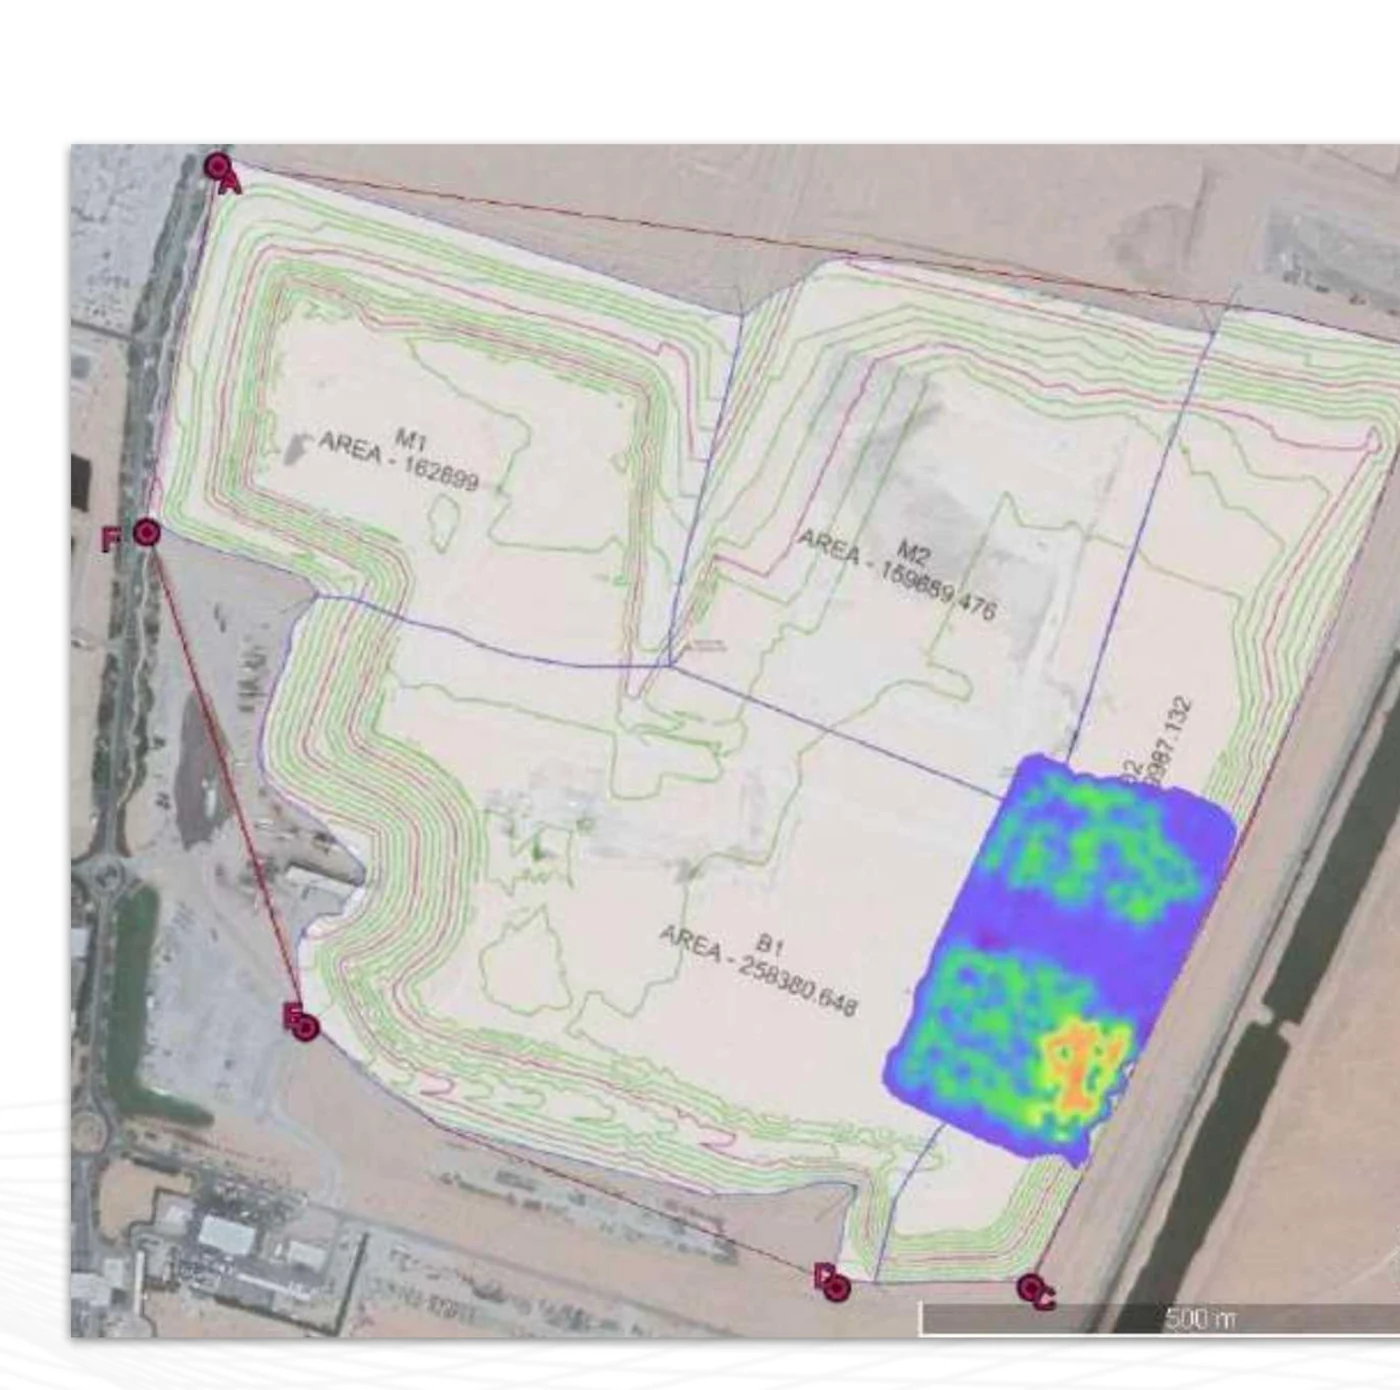
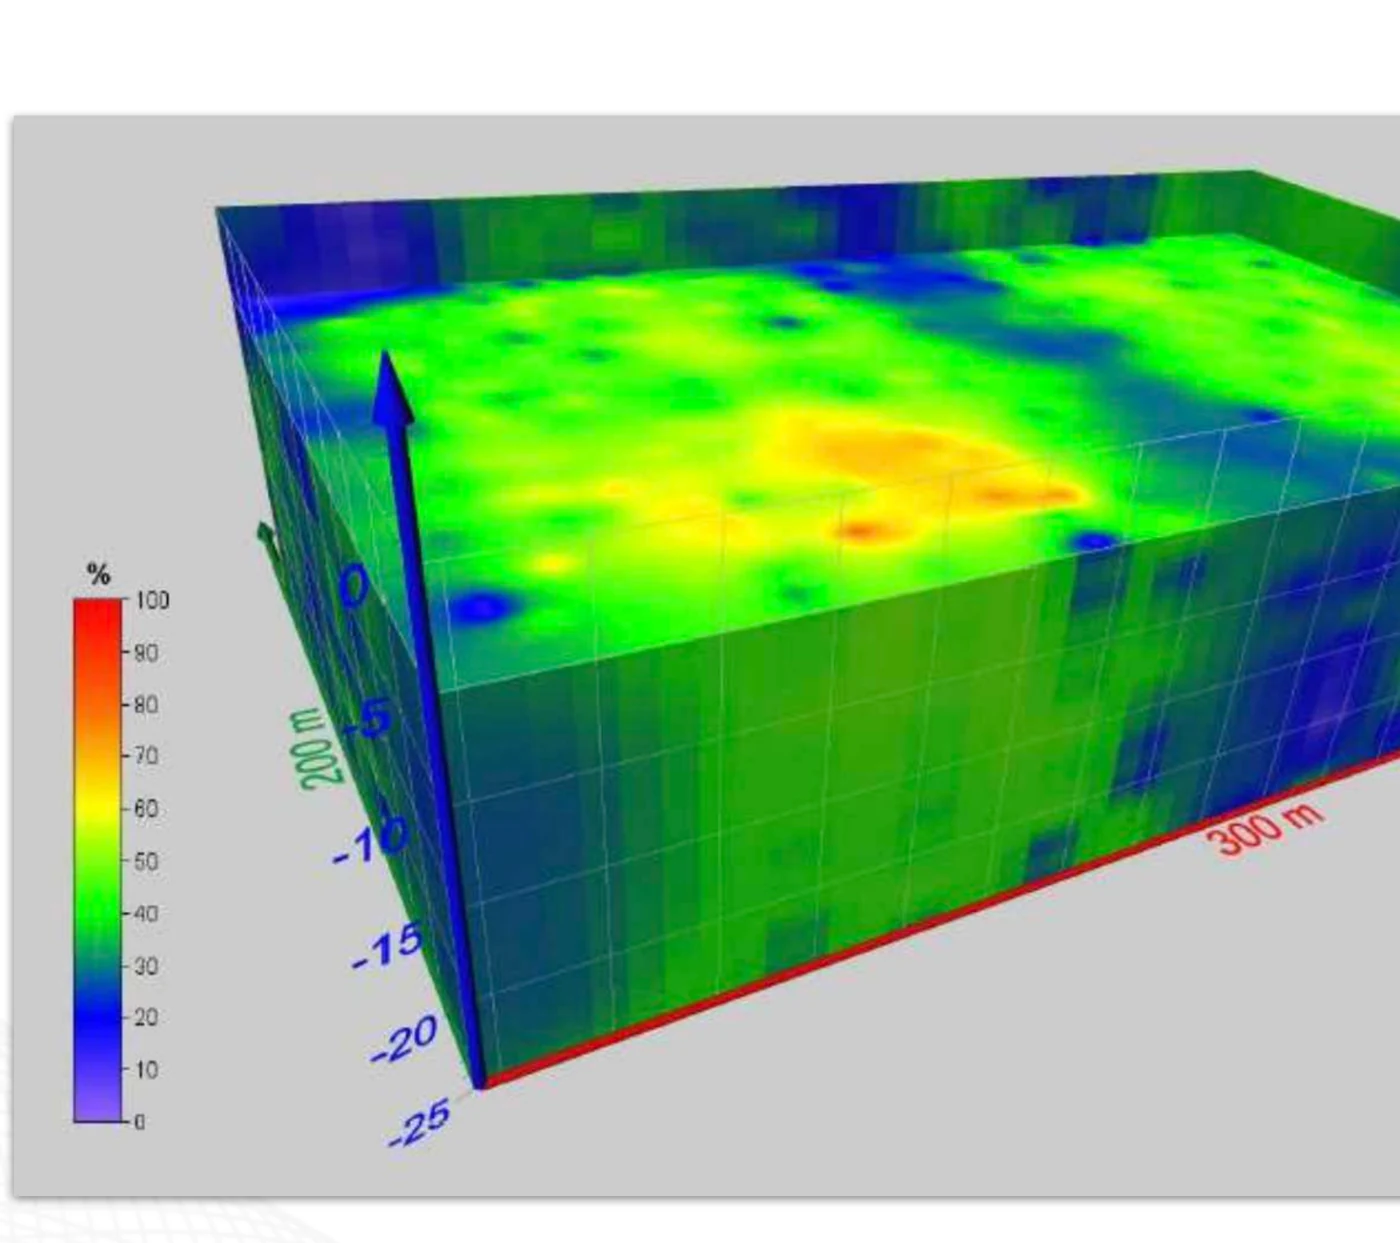
Area surveyed 70 km² landfill · methane concentration modelled to 25 m depth.
Methane mapped across a landfill operated by the Sharjah waste management entity, then modelled in three dimensions over the concentrated area. The client tested the result against physical drilling on its own site.
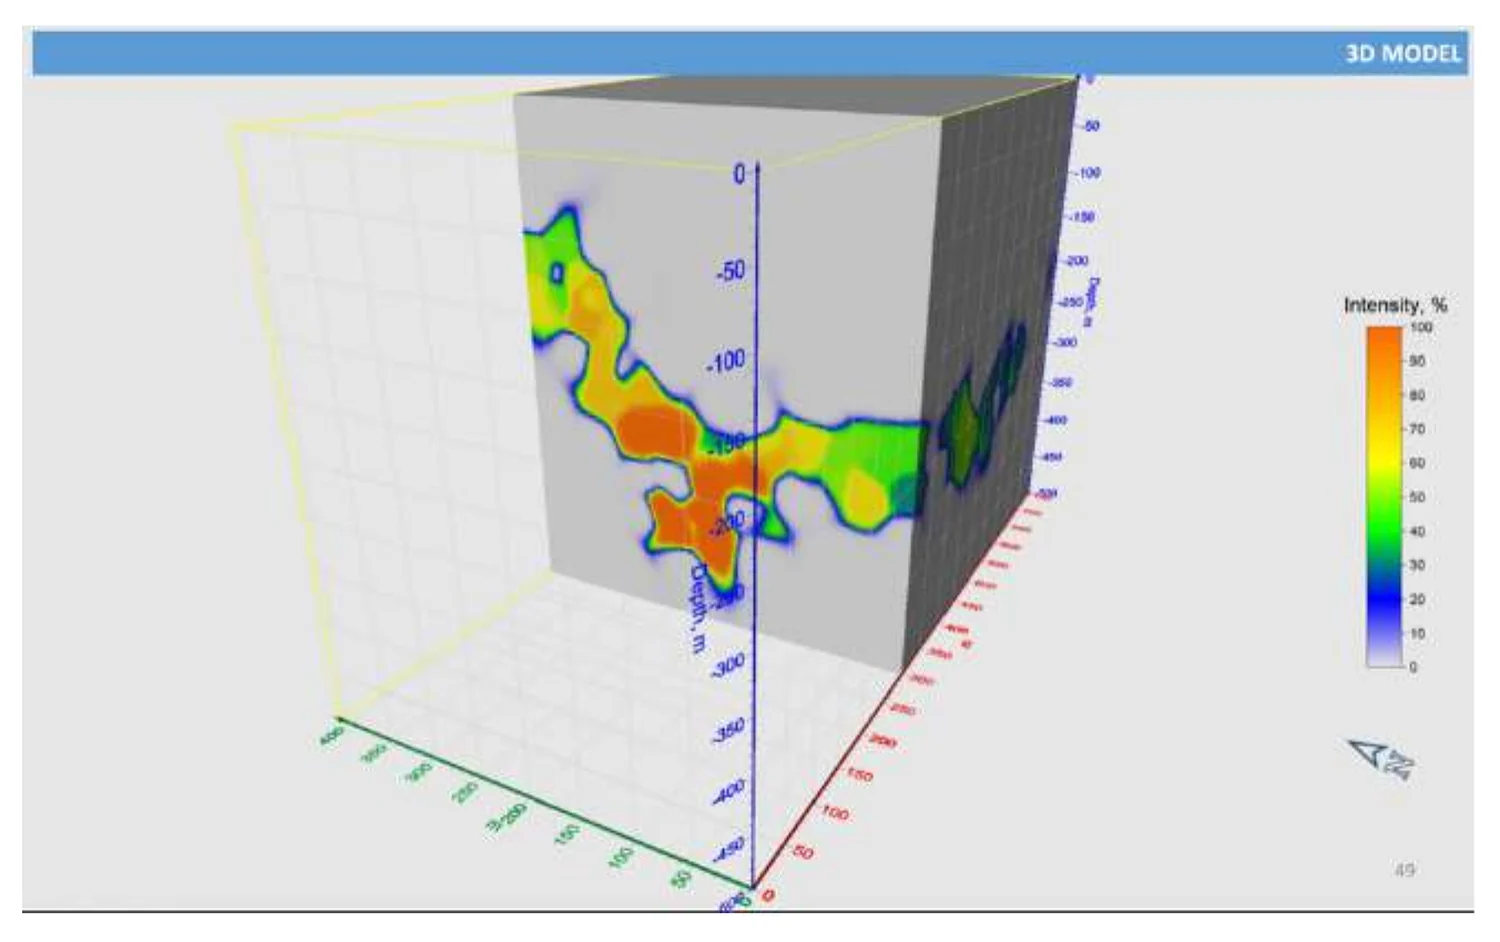
Rehoboth, Namibia
12.0 km² surveyed · 0.31 km² modelled in 3D · 100–450 m · 0.7–1.8 g/t · ~108 Mt at 30–100% intensity.
Gold anomalies mapped over the western part of the licence and inverted into a depth block, with three drill holes proposed on the target. The figures are exploration targets derived from remote sensing, not a mineral resource or reserve.
Kgalagadi District, Botswana · 2023–2025
Musa Metals Botswana (Pty) Ltd
85 km² surveyed within PL 165/2021 · nickel indicated 700–1,200 m · niobium 40–85 m · titanium to approximately 130 m.
Three elements read from one acquisition over the northern part of the licence. The operator subsequently commissioned an independent aeromagnetic interpretation, which found the nickel and niobium areas coincide with positive magnetic anomalies.
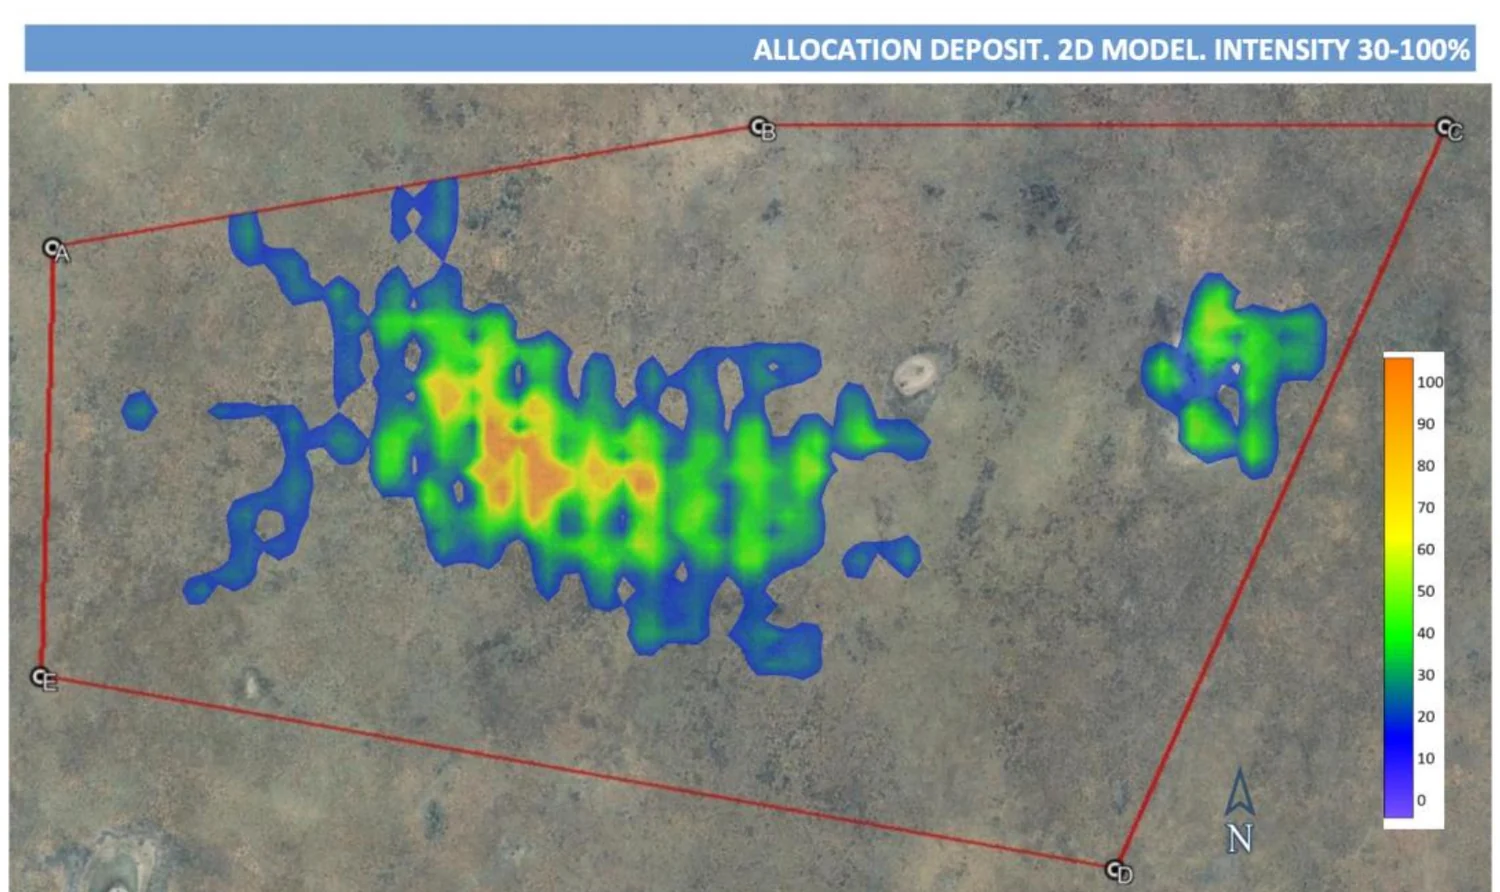
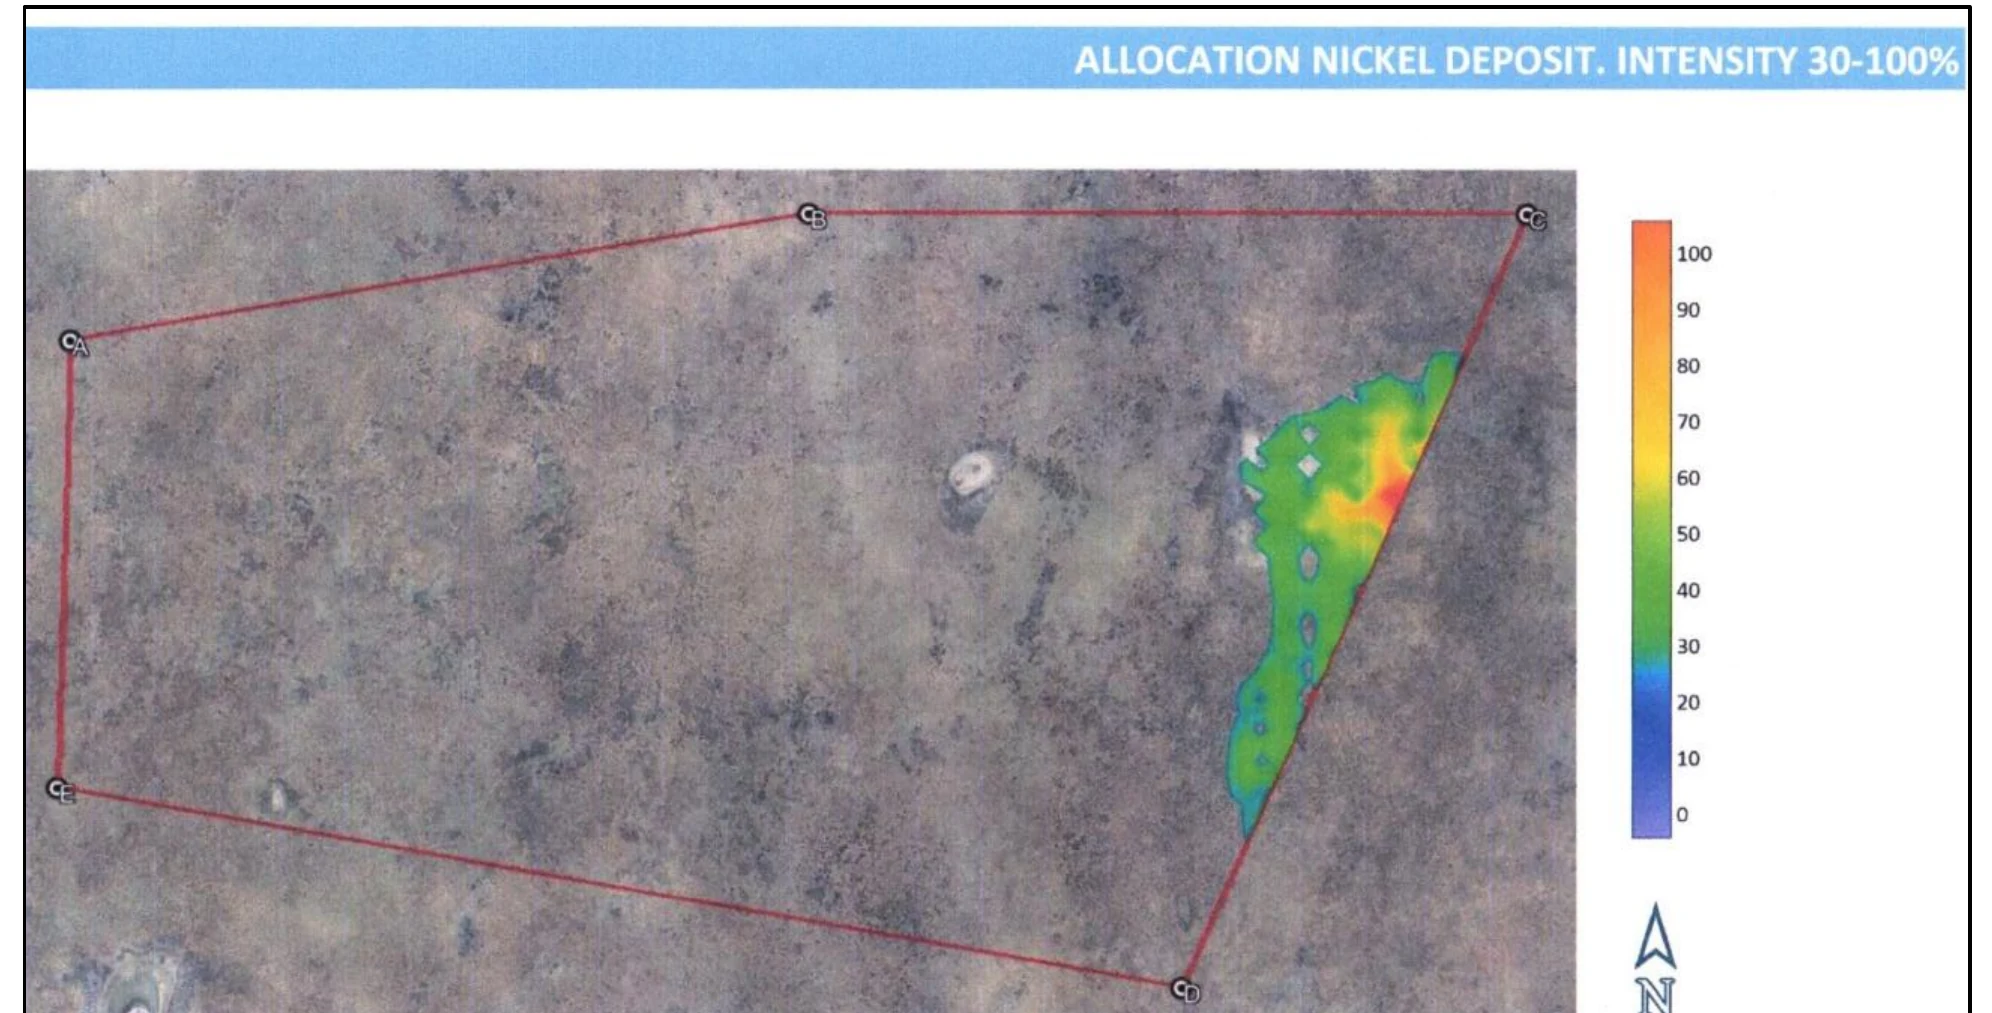
Figures as recorded in VMF survey reports and in independent NI 43-101 technical reports. Modelled volumes are exploration targets derived from remote sensing, not mineral resources or reserves.
Verified against drilling
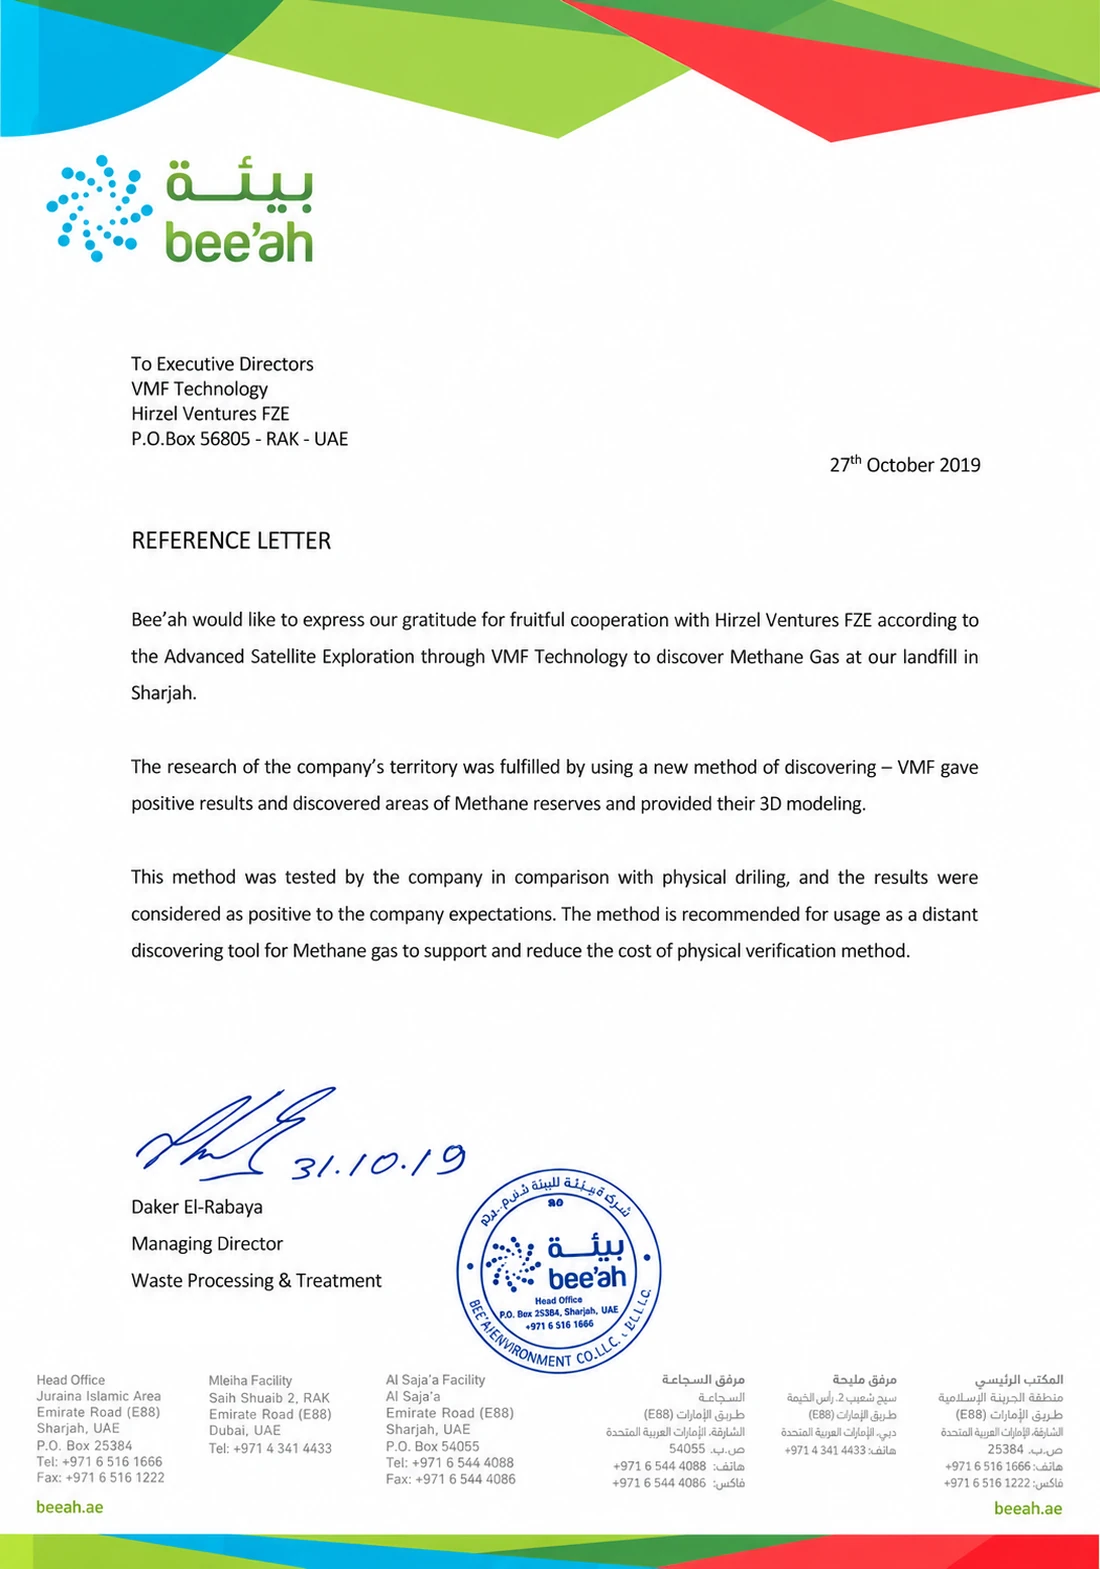
At bee'ah's landfill in Sharjah, the survey was not left as a model on a screen. The client tested it on its own site, against physical drilling.
The comparison was made by the client, on ground it knows better than anyone. This is its own record of the outcome.
“This method was tested by the company in comparison with physical drilling, and the results were considered as positive to the company expectations.”
Independent review
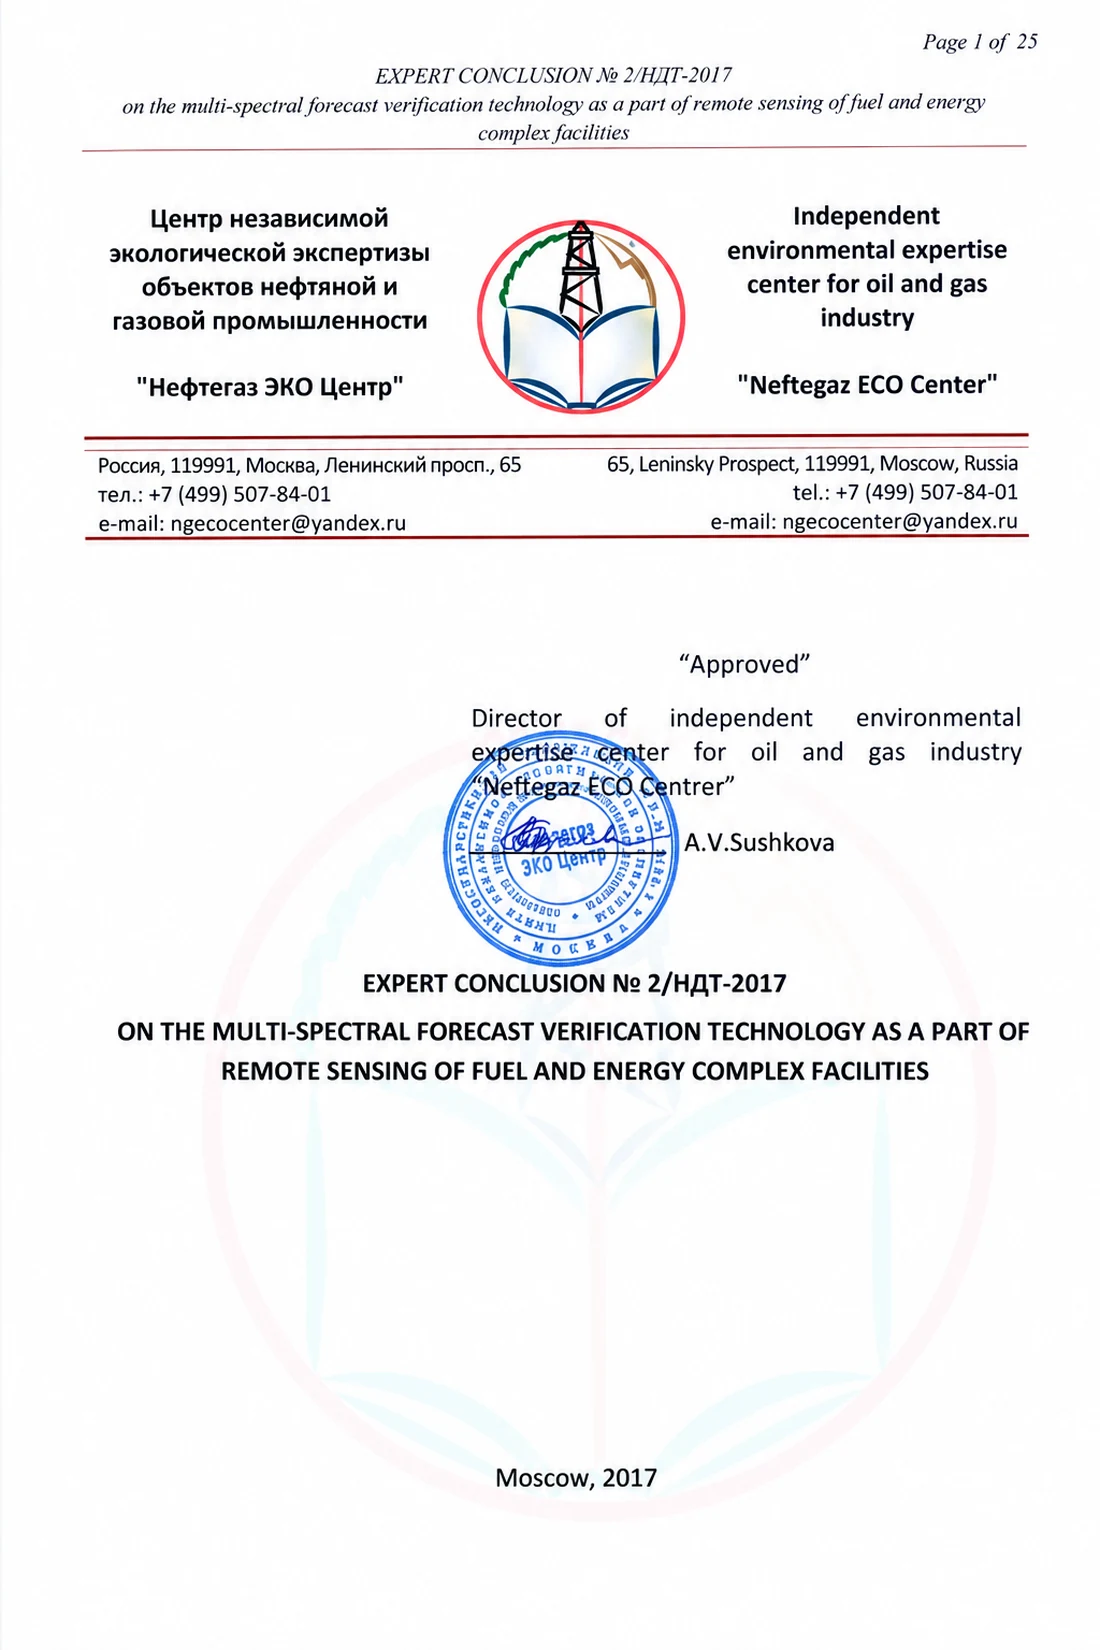
The method has been through an independent technical review. Neftegaz ECO Center — the independent environmental expertise centre for the oil and gas industry, working with Gubkin Russian State University of Oil and Gas — examined multispectral forecast verification as a remote sensing method for fuel and energy facilities and issued a formal expert conclusion.
We share the full conclusion on request.
Explore a completed survey
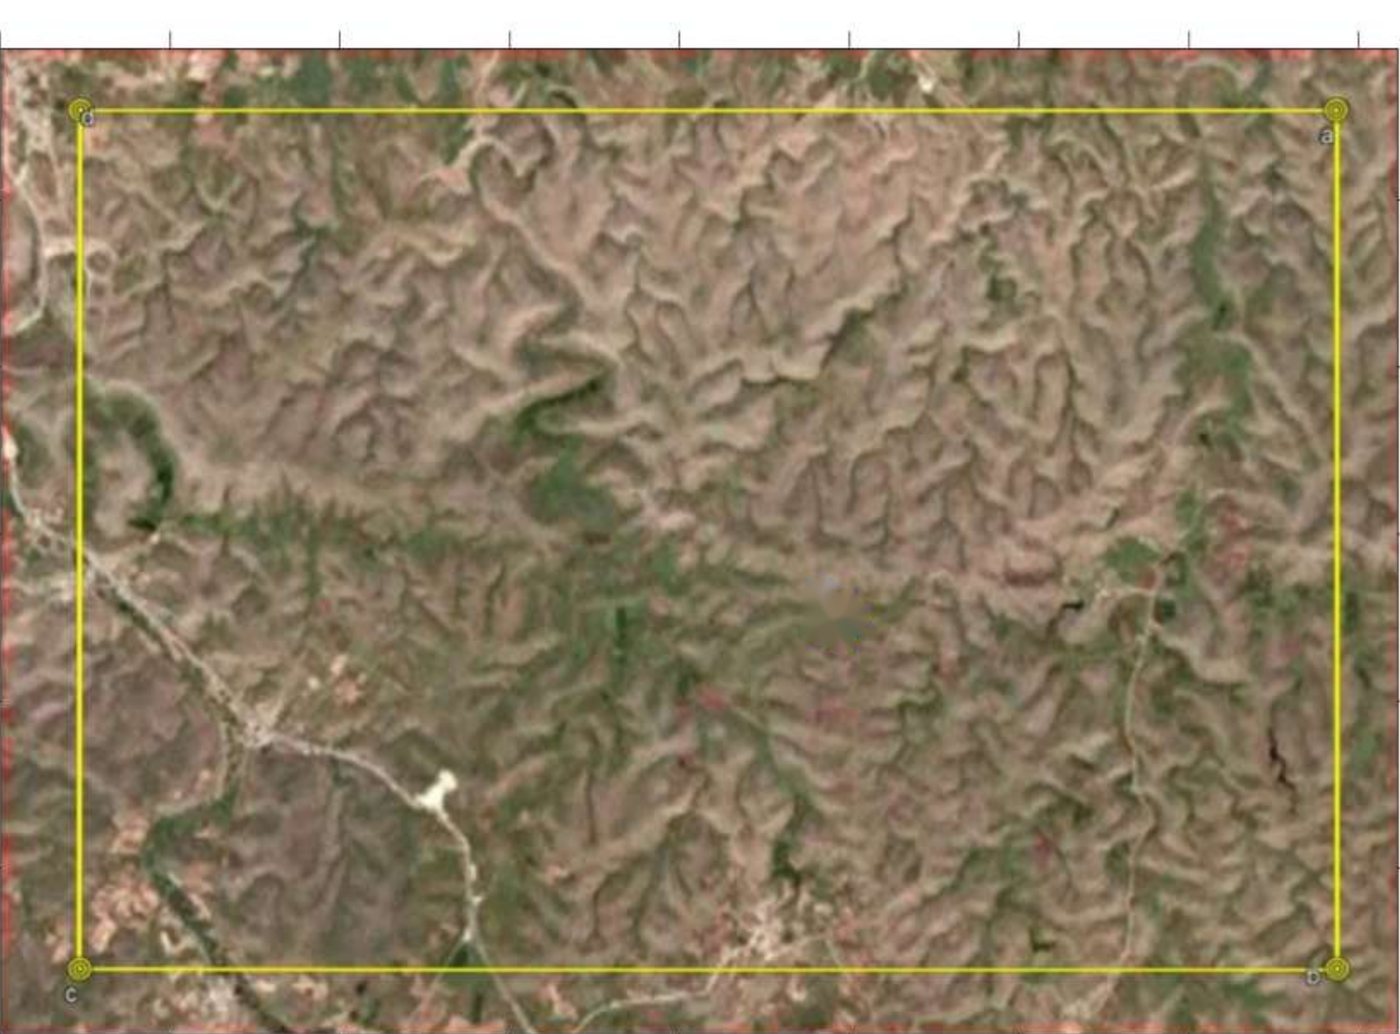
This is a hydrocarbon survey over 100 km² in Turkey. Drag the cut-off to watch the anomaly refine; drag the block to look at it from any angle.
Loading survey data…
0.00 km²
Anomaly area
0.0%
Of survey area
0%
Peak intensity
0.0%
Mean above cut-off
Marked cut-offs are the ones published in the report. Everything between them is interpolated from the same measured field.
Drag to rotate · scroll to zoom
Loading volume…
0
Voxels shown
900 m
Body top
1,900 m
Body base
The block is the modelled body from the report. Colour follows the same intensity scale as the 2D figures.
Depth structure decoded from the 29 vertical cross-sections published in the survey report; lateral extent constrained to the published 2D intensity map. Block 5,385 × 1,857 m, modelled between 900 and 1,900 m.
Independent corroboration
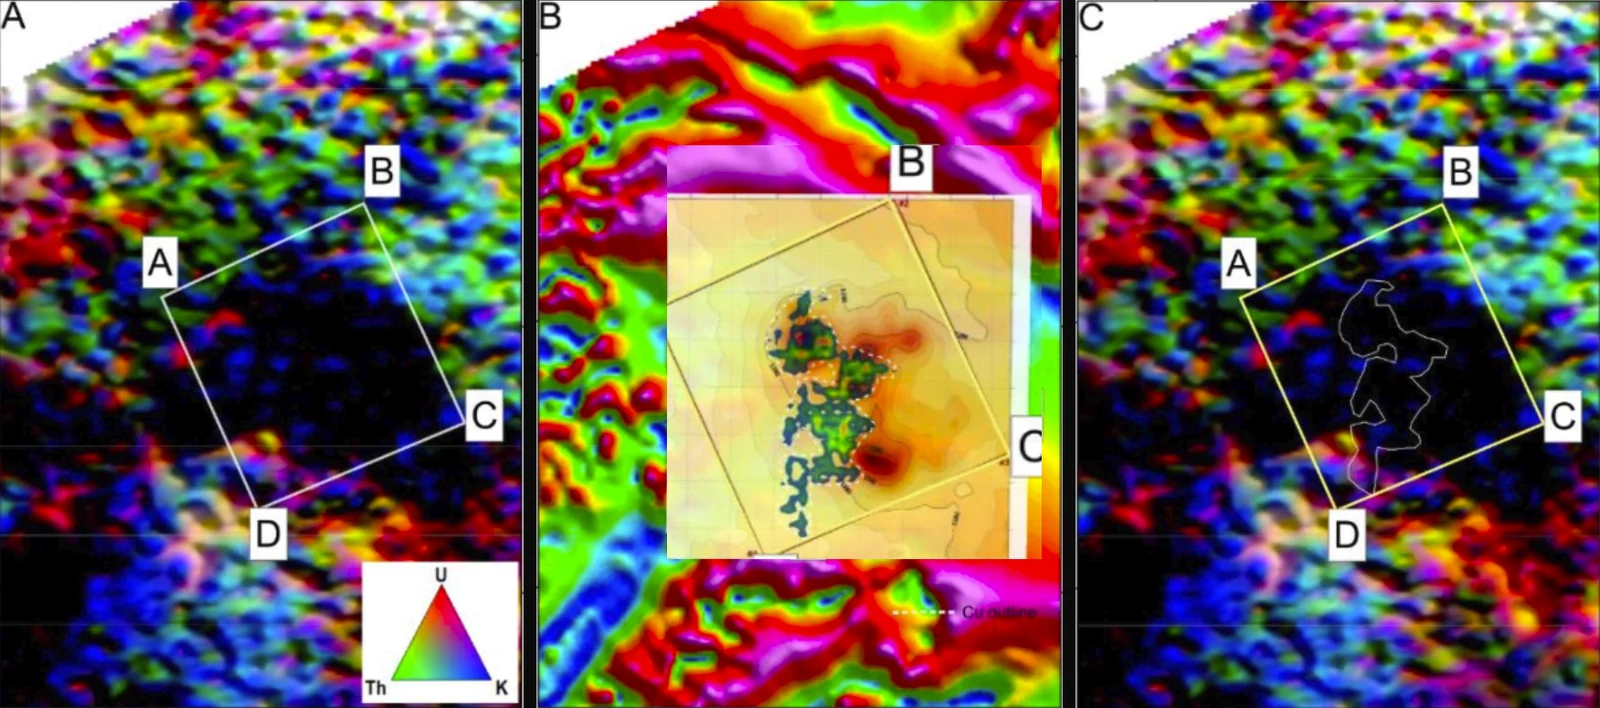
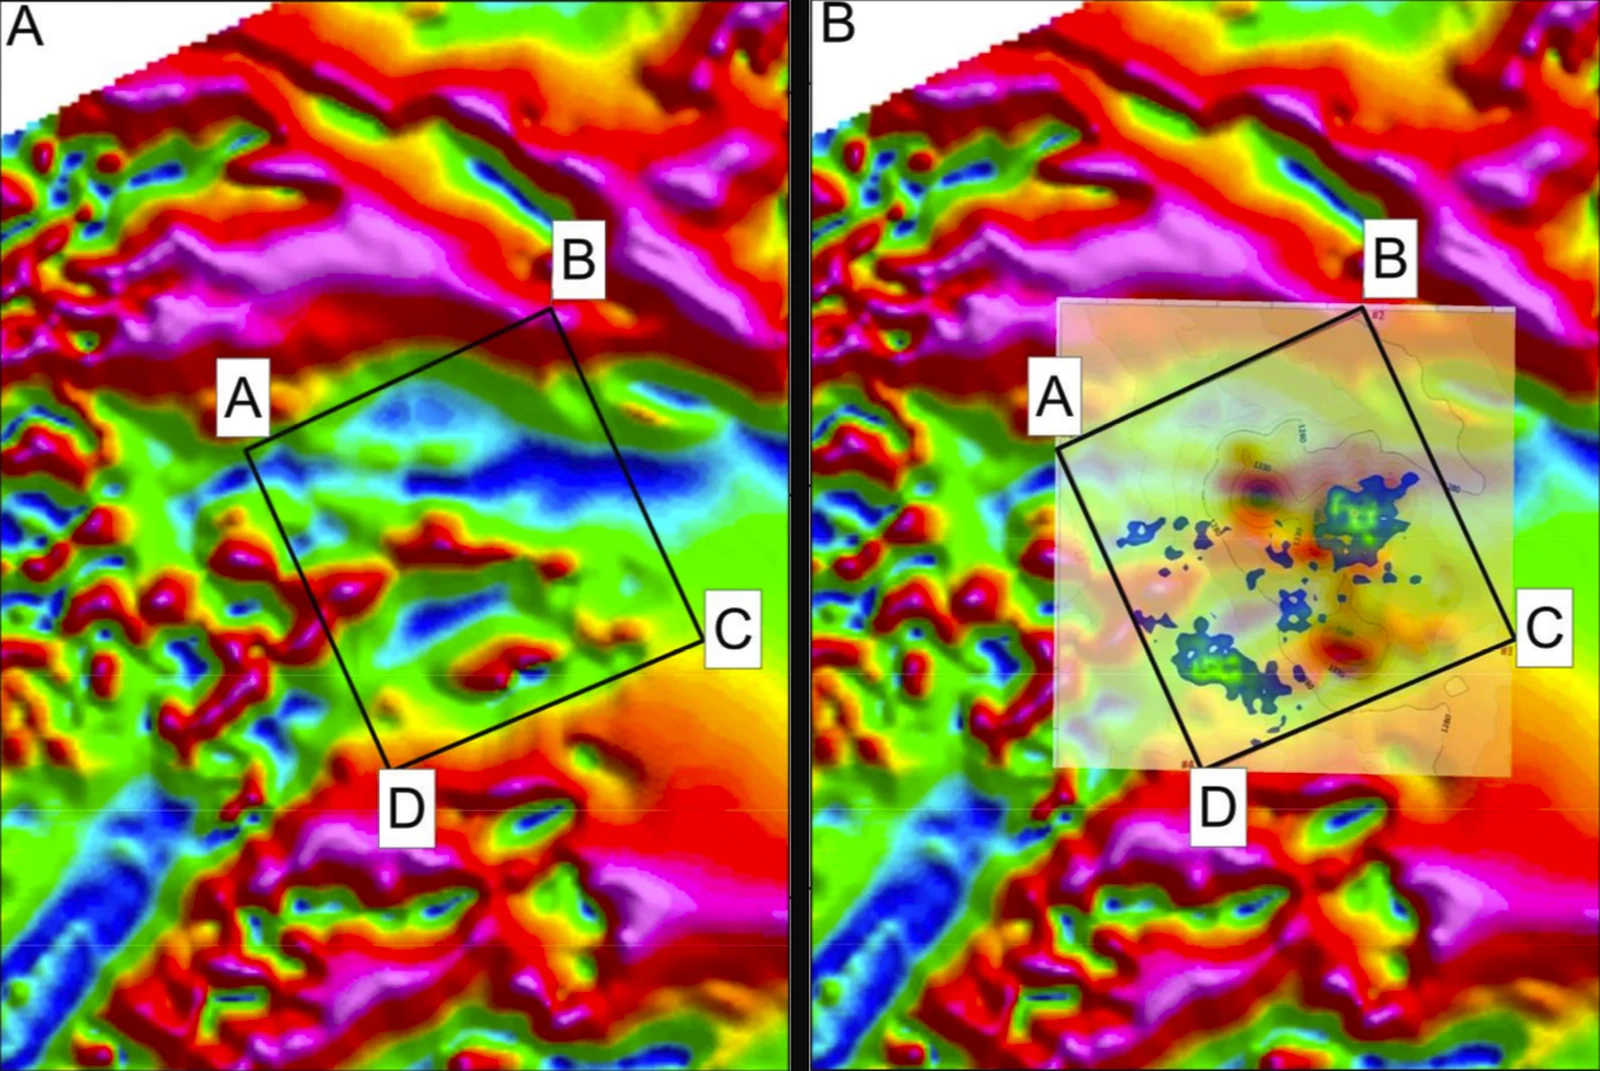
Starseed Global FZCO · Sinclair Mines, Namibia · report prepared by Dr Khumo Leseane, 10 January 2025.
Start a survey
Send the corner coordinates of a licence area and we will come back with what a VMF survey would cover, what it would cost, and how long it would take — before you commit anything to the ground.