Minerals
Every element has a signature. We read the one you are looking for.
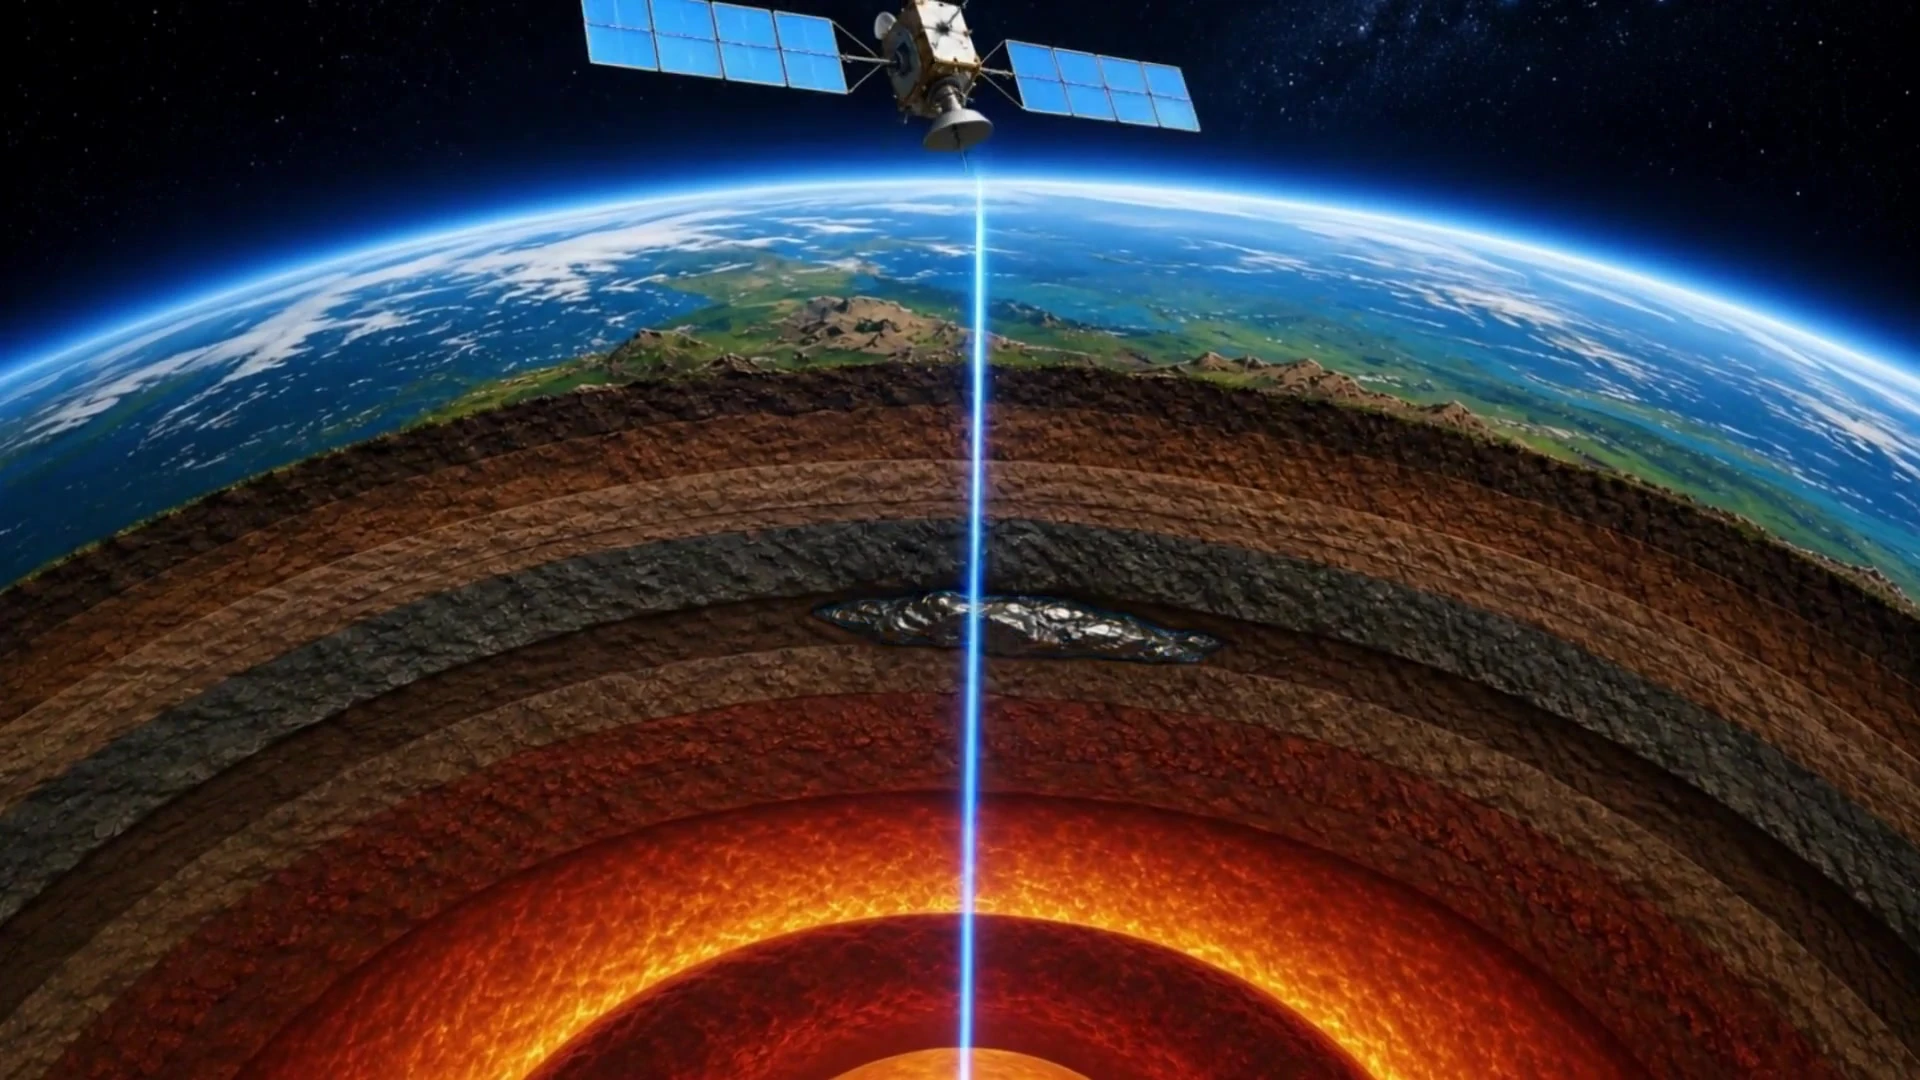
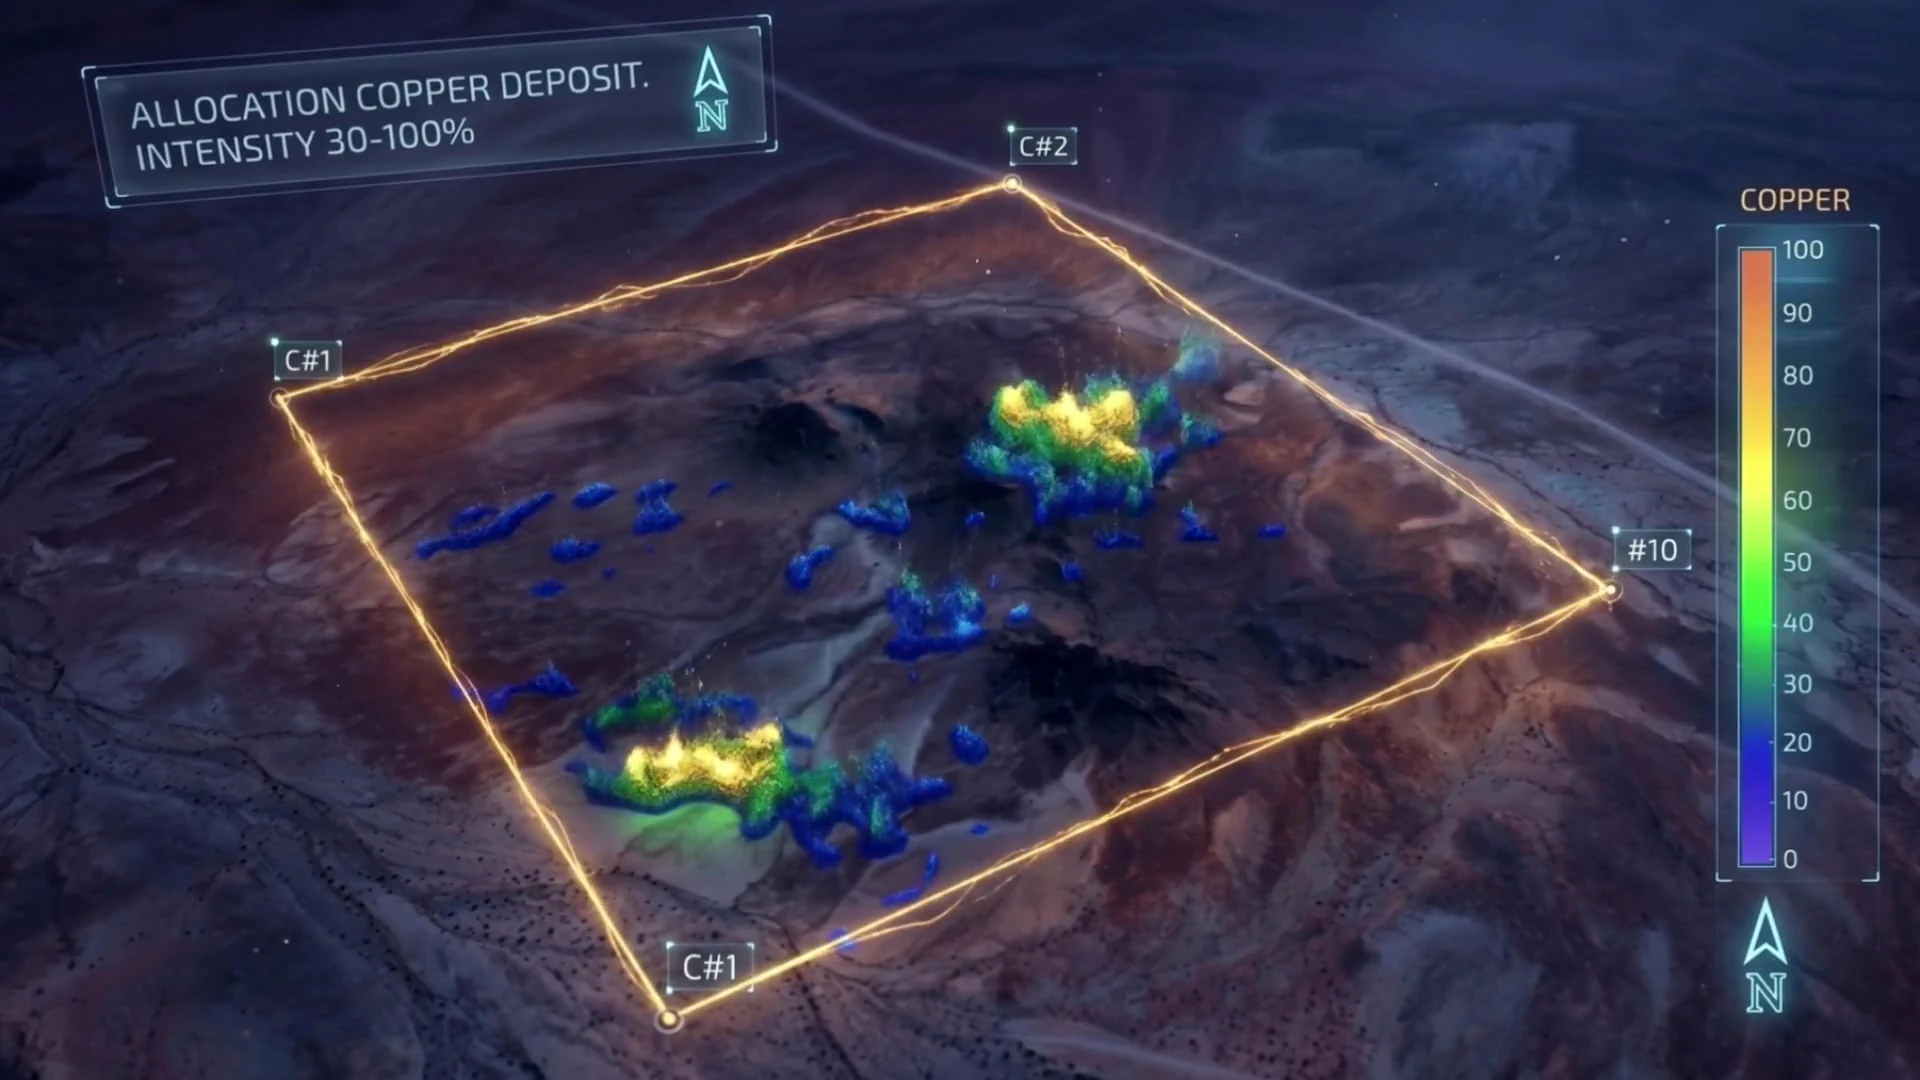
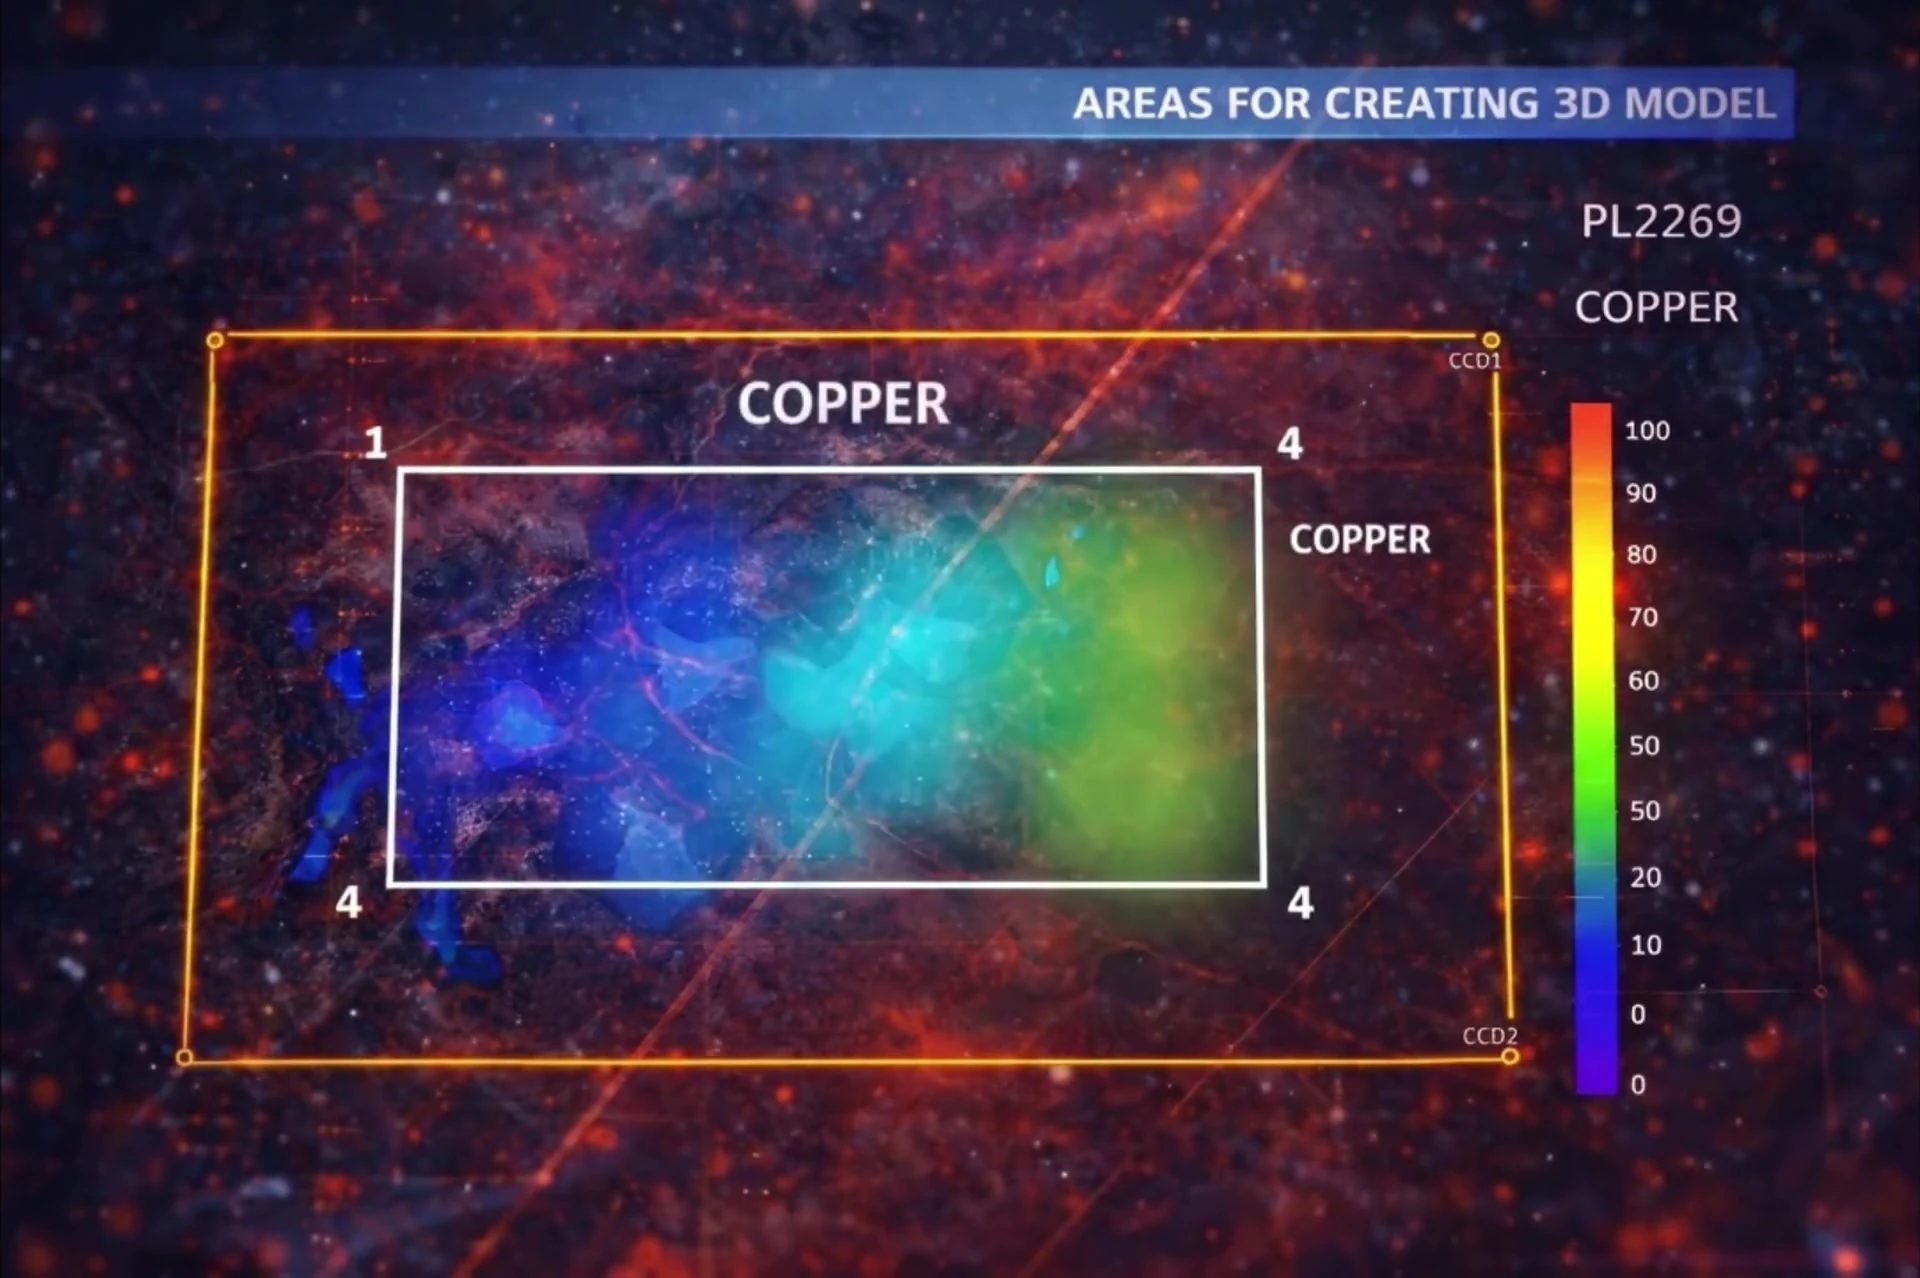
The target element is set before acquisition begins. VMF isolates its spectral response from everything around it and returns where it sits, how deep it runs and how much of it there is — across gold, copper, titanium, nickel, niobium and the wider critical minerals group.
Where VMF fits
Pre-bid screening
Identify where to drill on new blocks, sharpen exploration focus, and quickly shortlist high-prospectivity areas.

Where VMF fits
Greenfield exploration
Ground with no prior programme, ranked before the first hole is planned. The target element is set before acquisition begins.
Where VMF fits
Brownfield extension
Resurveying held legacy land to reveal hidden, untapped reserves.
Where VMF fits
Rescanning legacy ground
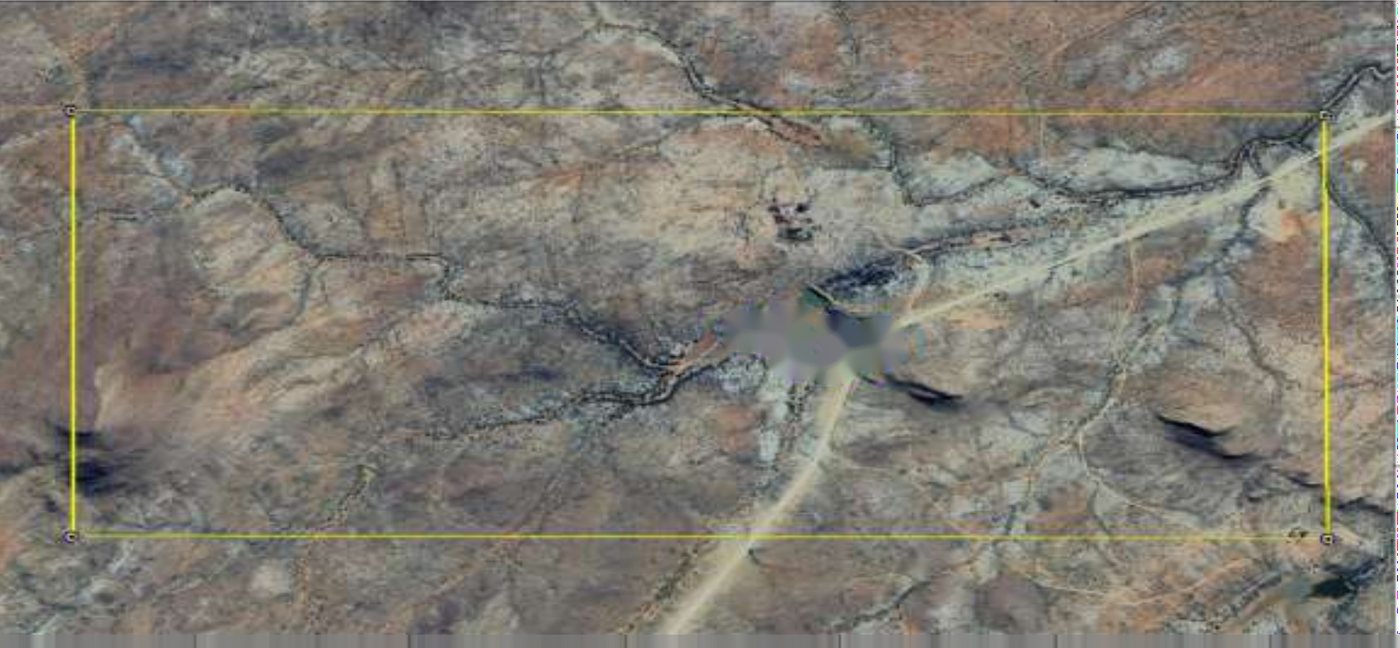
Ground last assessed on decades-old data, read again against present-day element libraries.
Case study
Gold survey — Marienhof Project, Namibia
12.0 km² surveyed · 0.31 km² modelled in 3D · 100–450 m · 0.7–1.8 g/t · ~108 Mt at 30–100% intensity
Loading survey data…
0.00 km²
Anomaly area
0.0%
Of survey area
0%
Peak intensity
0.0%
Mean above cut-off
Marked cut-offs are the ones published in the report. Everything between them is interpolated from the same measured field.
Drag to rotate · scroll to zoom
Loading volume…
0
Voxels shown
0 m
Body top
450 m
Body base
The block is the modelled body from the report. Colour follows the same intensity scale as the 2D figures.
Lateral extent measured from the survey's 2D intensity map. Depth structure modelled from the report's stated 100–450 m range, dipping south and plunging east as described. T1–T3 are the trial drilling collars at their surveyed coordinates.
- 12.0 km²
- Survey area
- 0.31 km²
- Gold 3D block
- 100–350 m
- Gold depth
- 0.7–1.8 g/t
- Estimated grade
- 0.50 km²
- Copper 3D block
- 220–370 m
- Copper depth
Modelled volumes are exploration targets derived from remote sensing, not mineral resources or reserves.
Same acquisition
Copper over the same licence
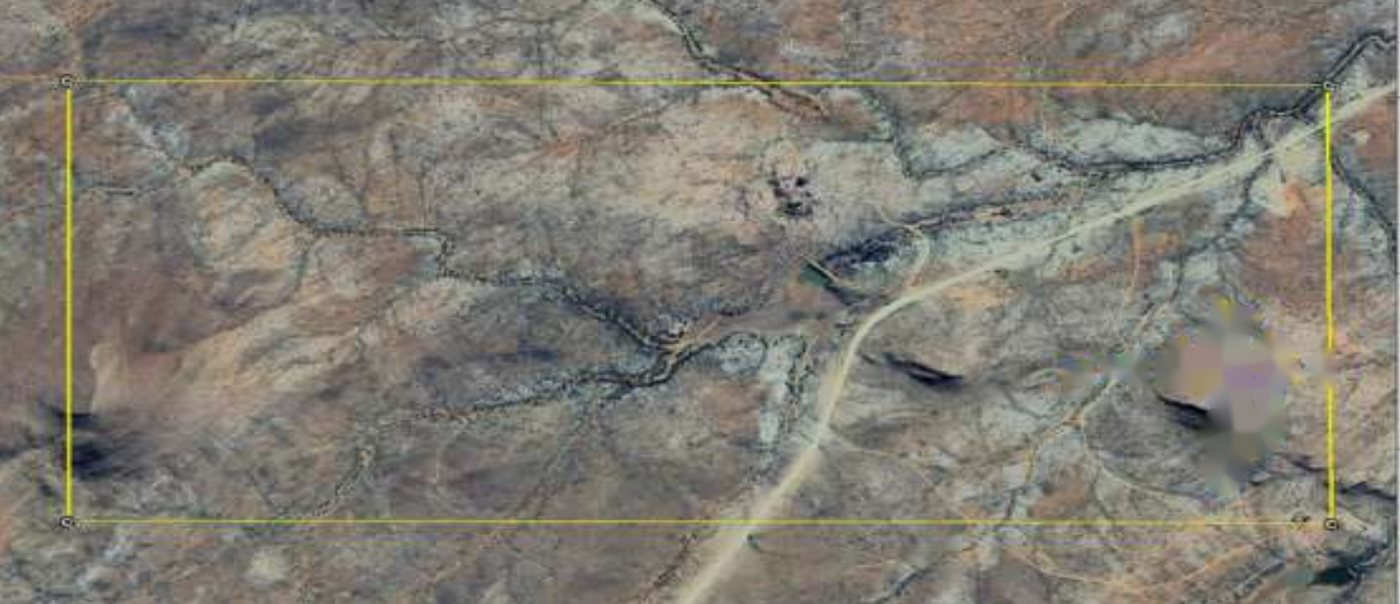
Loading survey data…
0.00 km²
Anomaly area
0.0%
Of survey area
0%
Peak intensity
0.0%
Mean above cut-off
Marked cut-offs are the ones published in the report. Everything between them is interpolated from the same measured field.
Also surveyed
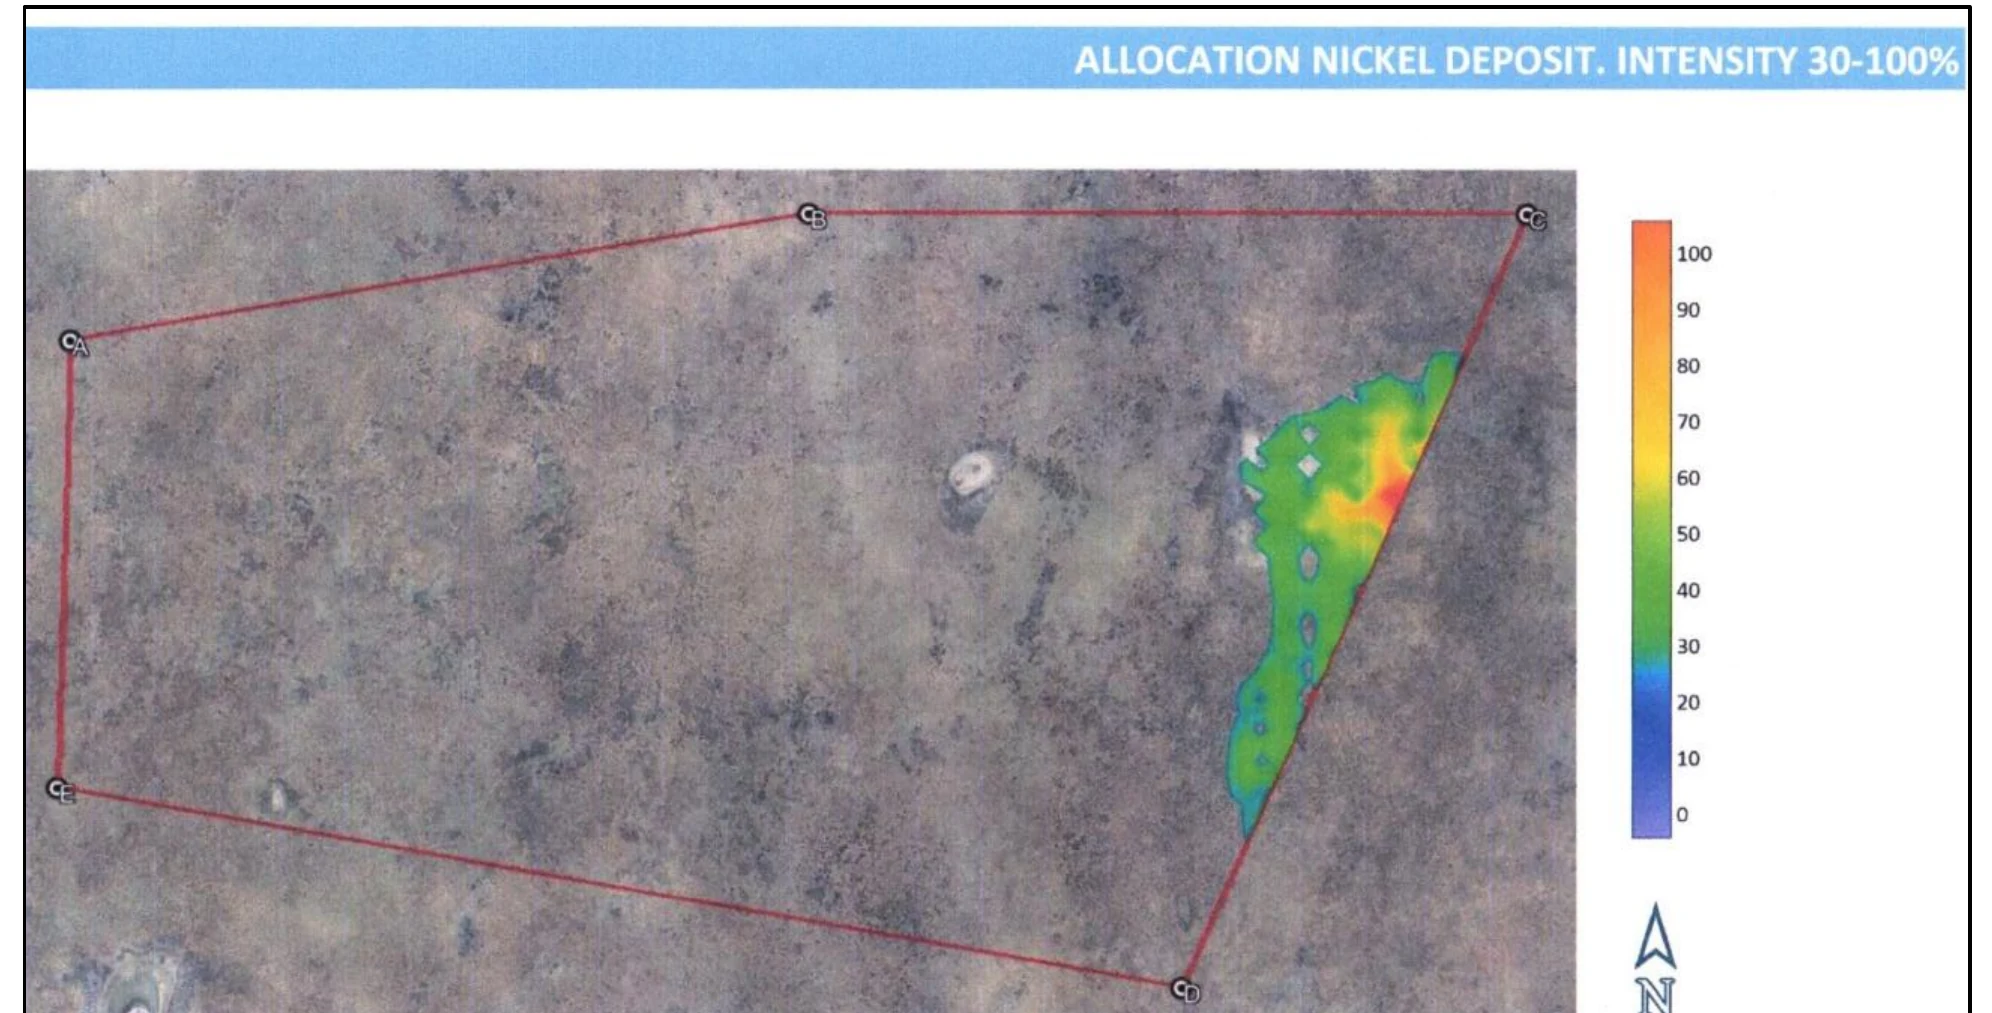
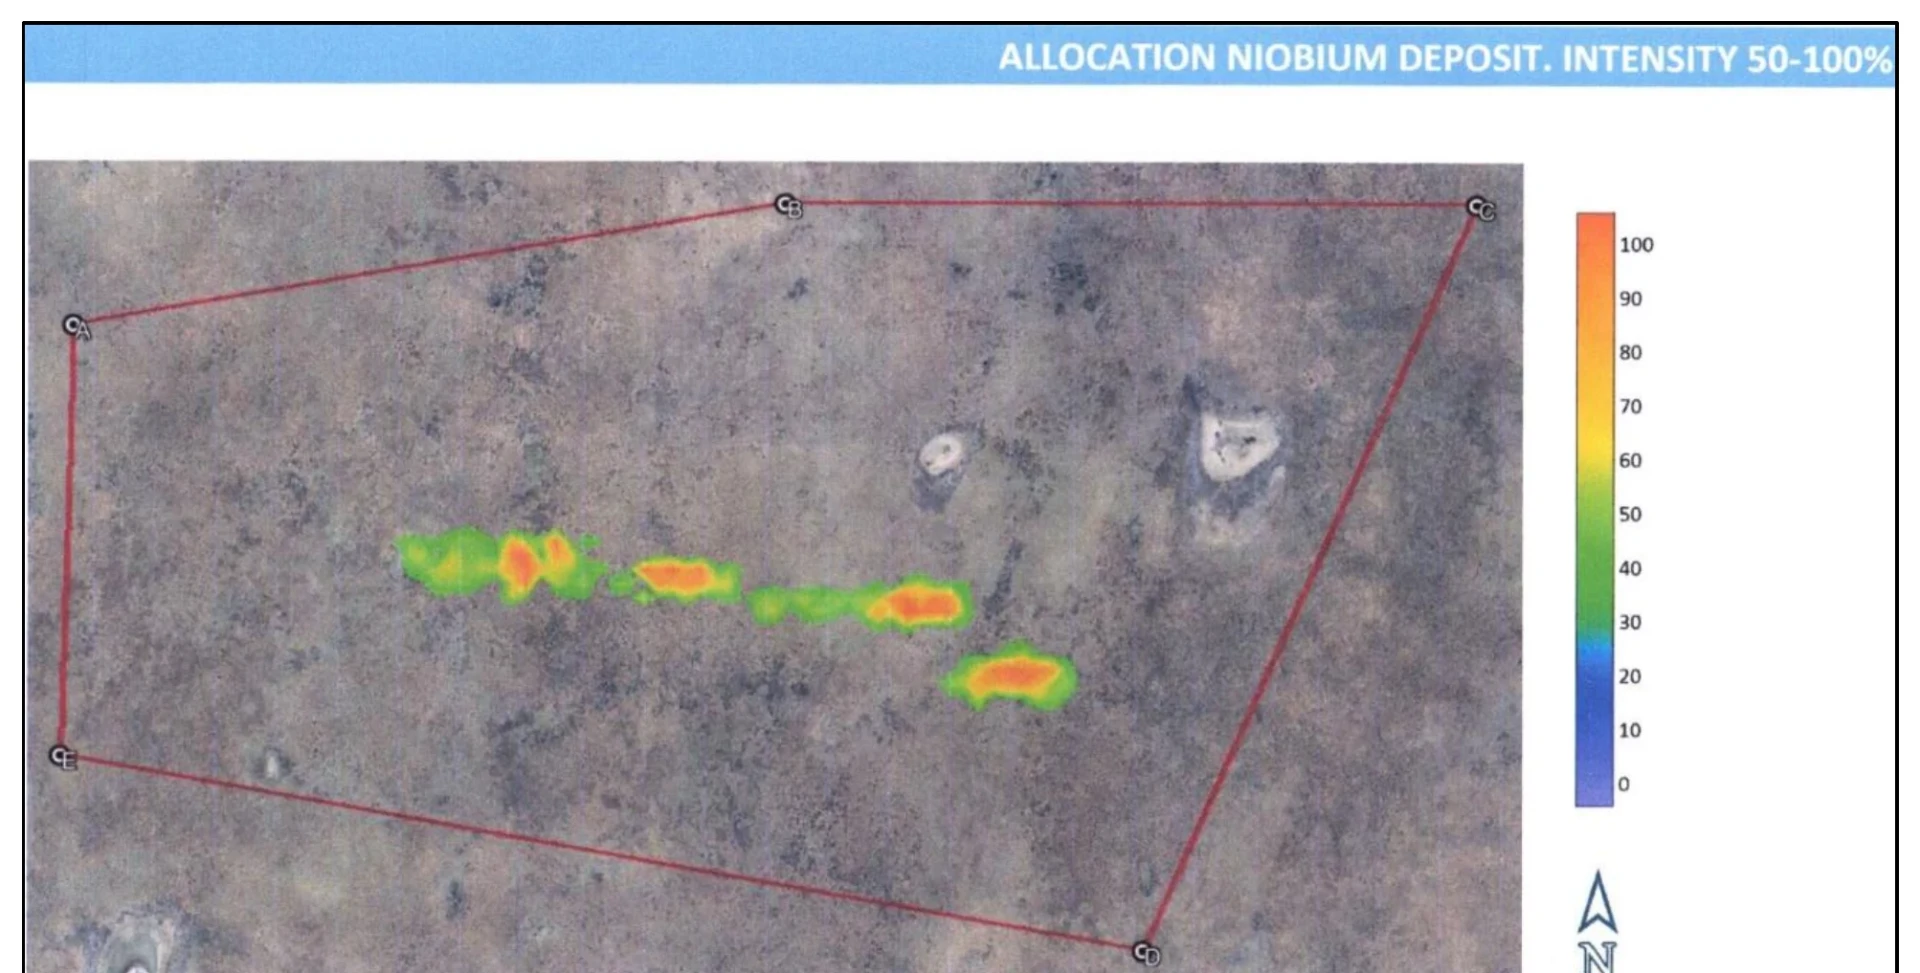
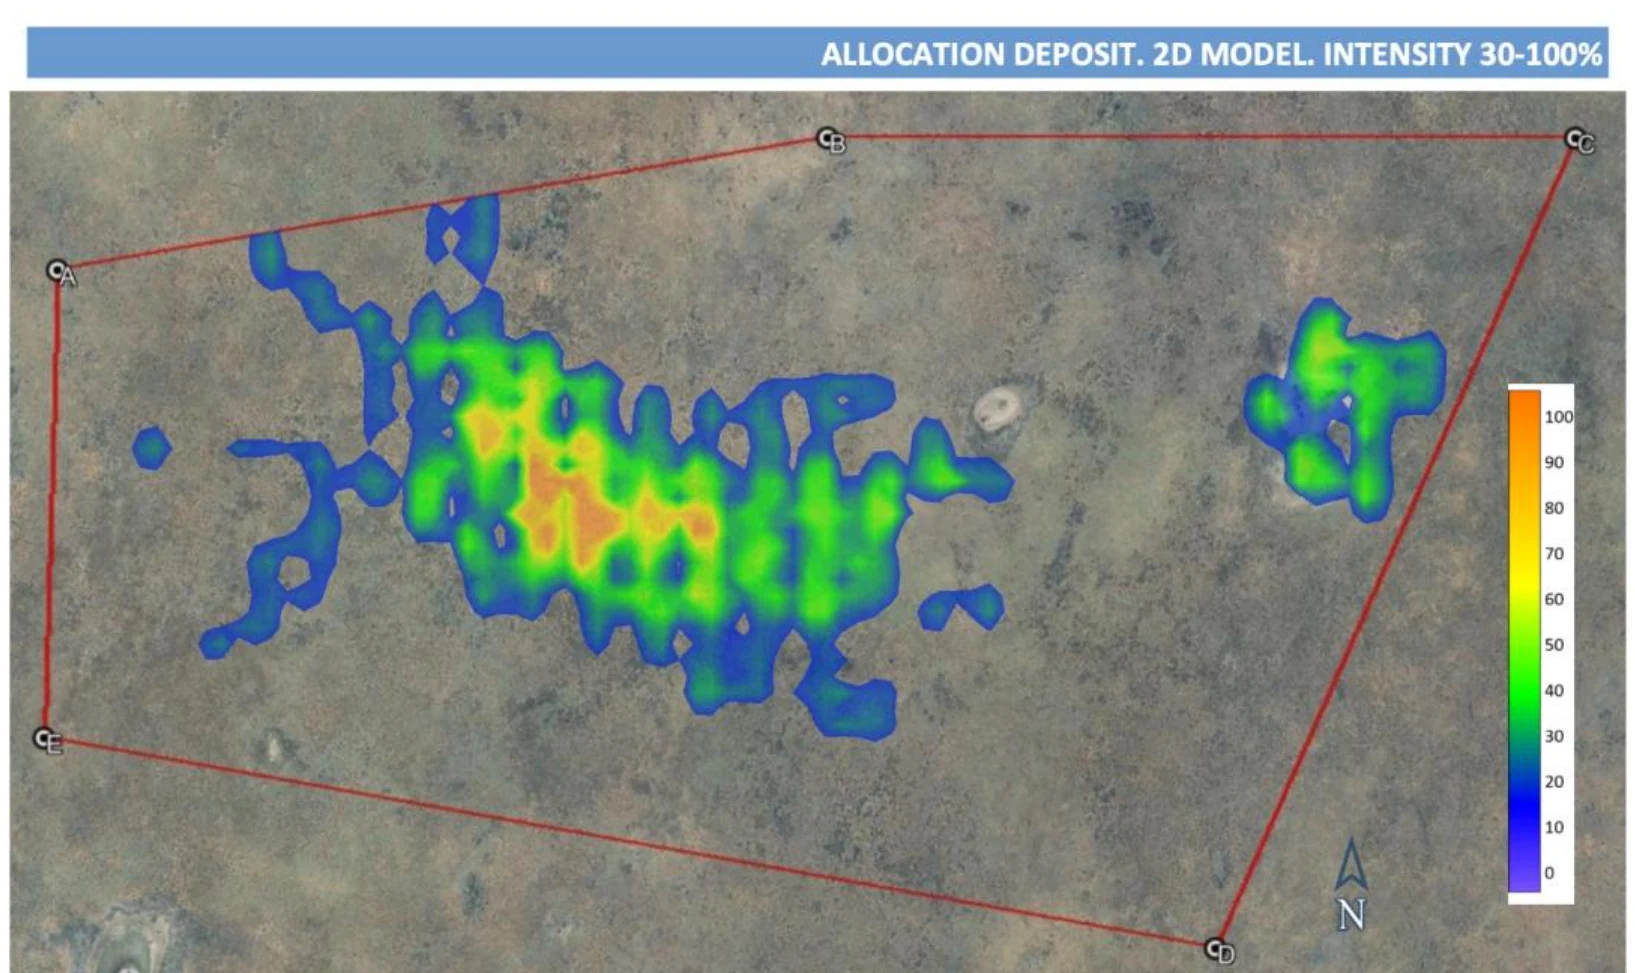
Kokong Project, Botswana
An 85 km² VMF survey across PL 165/2021 for Musa Metals Botswana, covering three separate targets in one acquisition.
Independent corroboration
Read against an independent geophysical survey.
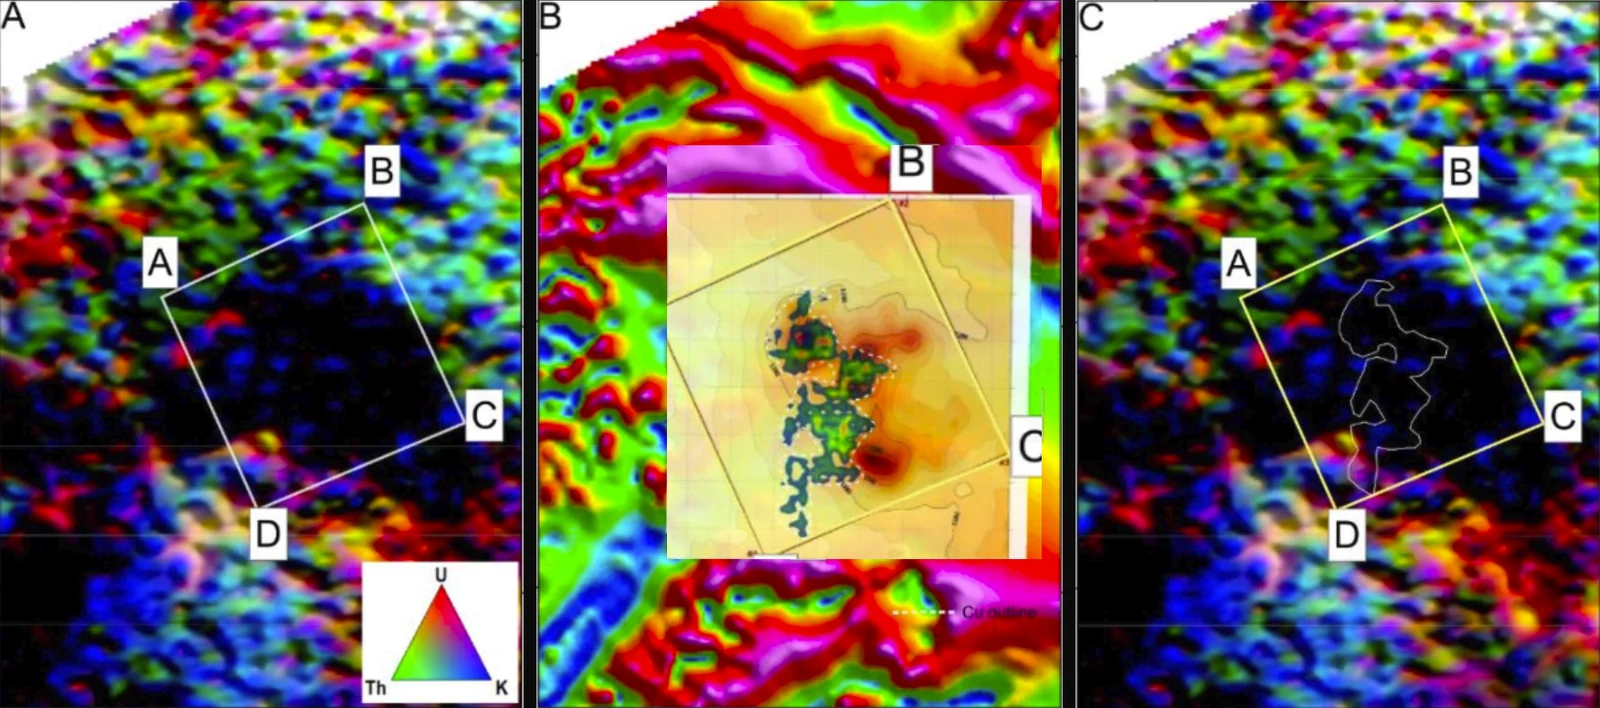
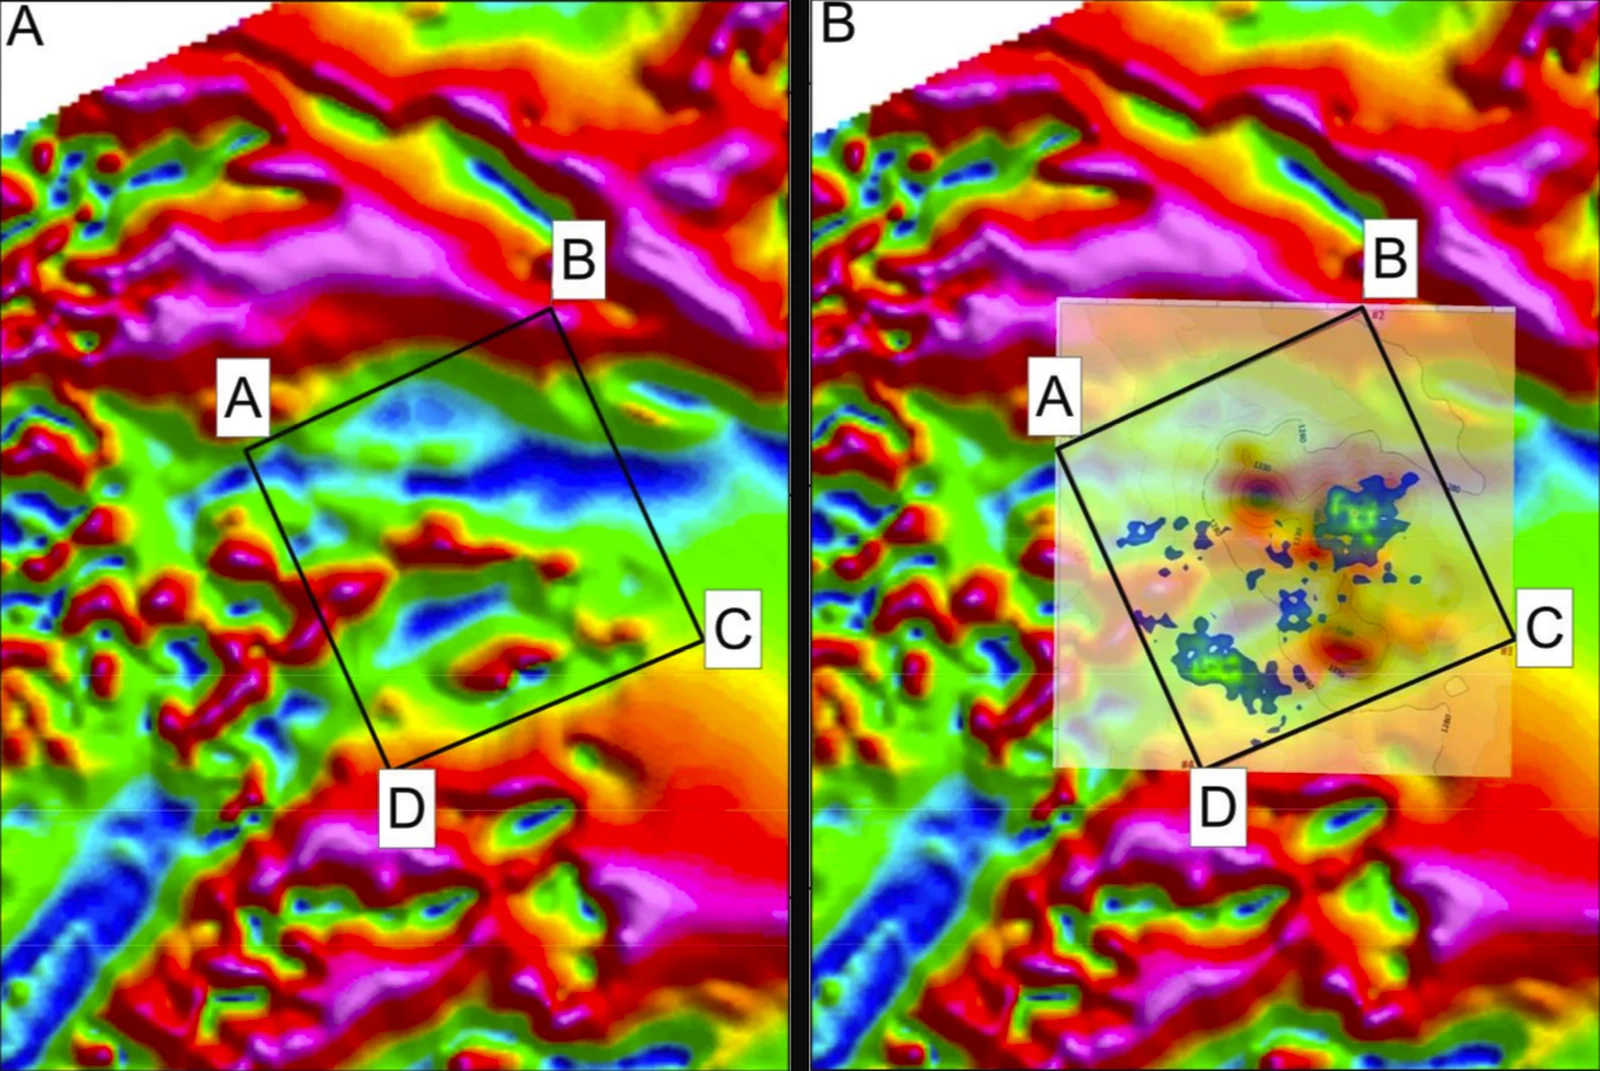
Starseed Global FZCO · Sinclair Mines, Namibia · report prepared by Dr Khumo Leseane, 10 January 2025.
What arrives at the end of a survey.
2D stage
- A georeferenced concentration map across the full licence area
- Intensity plotted 0–100%
- The area recommended for 3D modelling
3D stage
- A depth model of the selected block
- Volume estimate for the modelled body
- Estimated average concentration
- Drilling reference points with coordinates
- A written report
Typical turnaround, tender to 3D model: two to three months.
Trusted by